
Silver long-term technical analysis
Silver made the first close below $16.50 support level since January rally above the level. This means the closing price of silver in November ($16.36) has lost $2.26 (-12.13%) from $18.62 high. Though, silver still gain 3% from this year opening level of $15.88.
This month is the last month of 2017 and crucial moment for the silver bull. The bull needs to bring the price higher above $16.50 and cancel November bearish close. U.S dollar index might not become the major factor which influences silver this time as the index also logged lost in November.

Click here to see previous Silver long-term technical analysis November 2017
Monthly chart
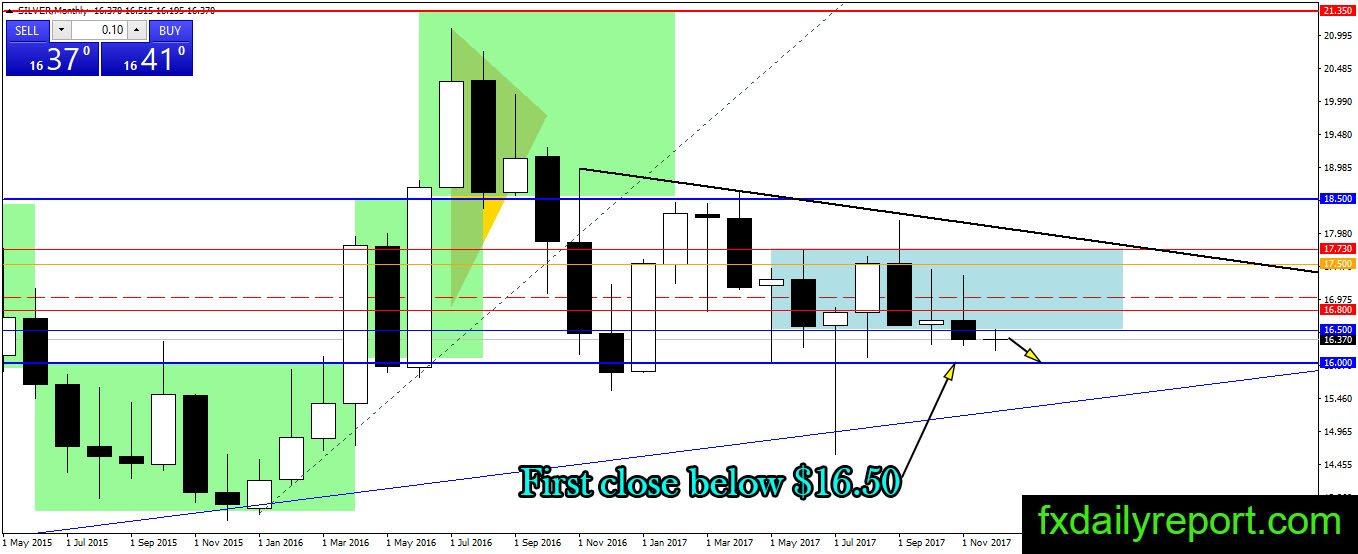
The price closed below $16.50 for the first time on the monthly chart. There is bearish interest to bring silver lower, but there is also major support level at $16.00. If the price continues lower, traders might observe reaction at $16.00 and place long position on a strong reversal.
Weekly chart
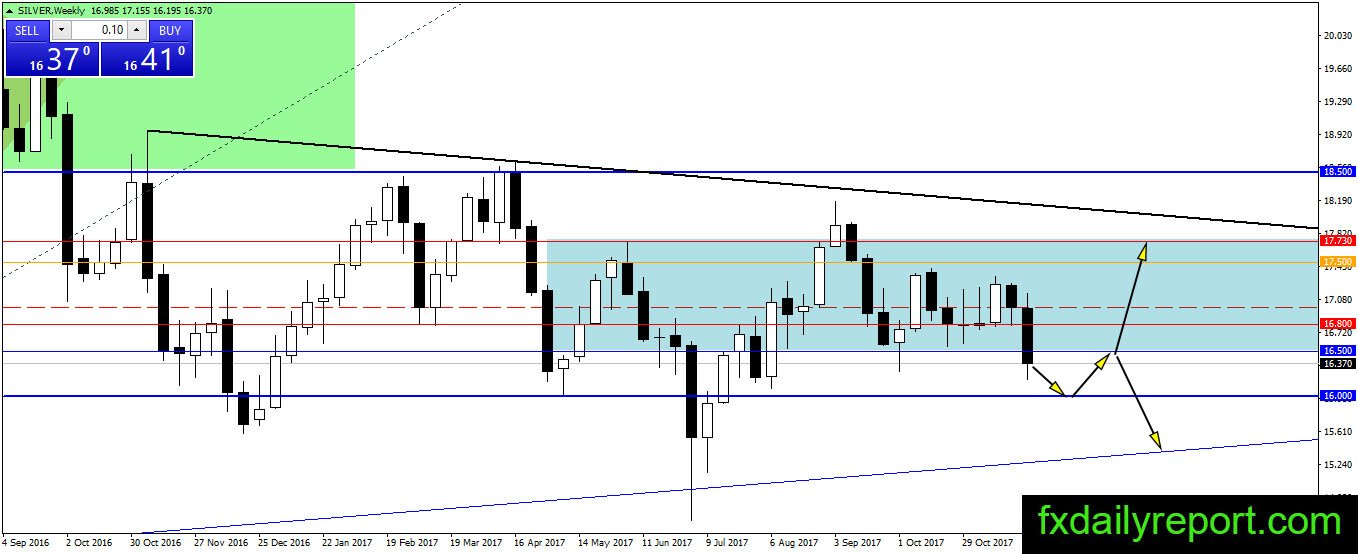
Silver bear prepared to seize the $16.00 support on the weekly chart after it captures $16.50. There is an opportunity to short the precious metal on $16.50 re-test with $16.00 target. Traders could place a stop above $16.80 and observe the sentiment.
Daily chart
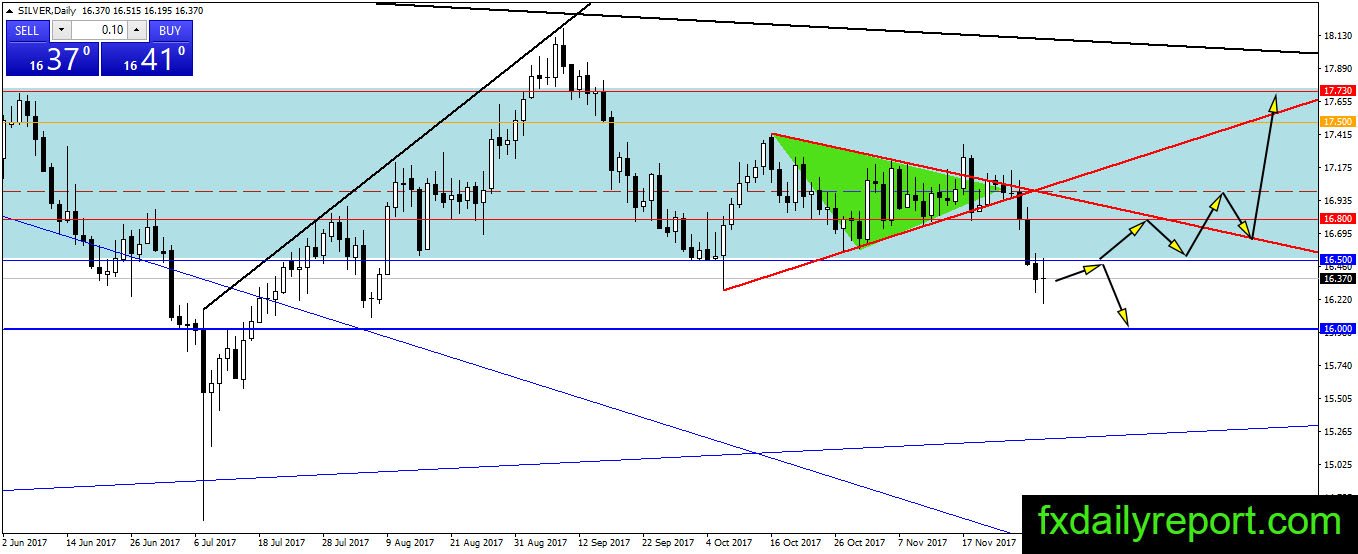
The bear is in full control after the price breakout from triangle pattern on the daily chart. The closure below $16.50 show first retest on the support turned resistance. If the bear could keep the situation under control, we might see the price drifting near $16.00 this week.
Trade plan
Bullish: Bull traders might need to wait until the price move lower to $16.00 support before placing long position. Another scenario to consider is the return of silver above $16.50.
Bearish: $16.50 is the resistance to watch for a short position. If the bull manages to bring the price back above $16.50 or worse $16.80, traders might need to bailout from short position.