
Silver long-term technical analysis
Silver launch from support $14.00 continue in January and closed near $16.00. The event is normal and it is the time for the precious metal to determine the next long-term direction. If silver descends from the current level and closed below January low $15.13 then we could expect bearish trend continuation.
On the other hand, a close above $16.00 might cancel the bearish outlook. At the current time, traders suggested waiting for the conclusion of the resistance test.

Click here to see previous Silver long-term technical analysis January 2019
Monthly chart

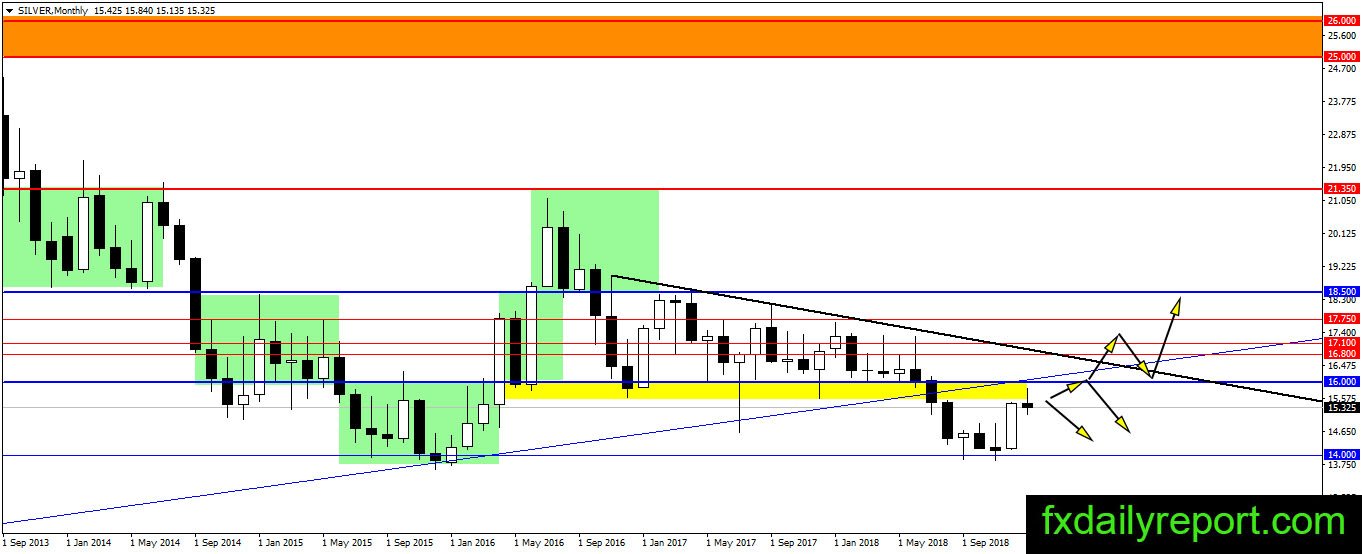
Silver closed at $16.00 in January provide us with no breakout nor rejection from the resistance level. This month, the bear attempting to push the precious metal lower but it seems the bullish pressure might continue. $16.00 is a hard level to break and it is possible for silver to continue stick near the level.
The bear might have the upper hand as it only needs a strong bearish pattern from the current level.
Weekly chart
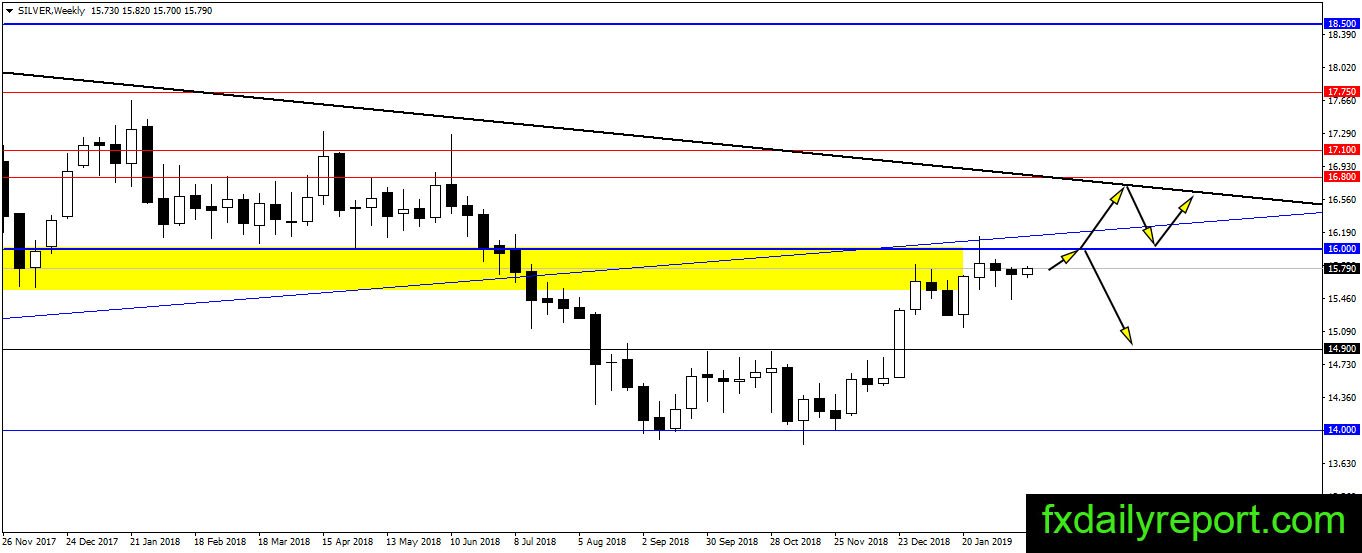
A breakout above $14.90 is the bullish trigger for current upward movement. There is no major rejection from the $16.00 resistance and it is better for traders to continue holding long position or stay sideline. Short position near $16.00 with tight stop might become an option for bear traders.
Daily chart
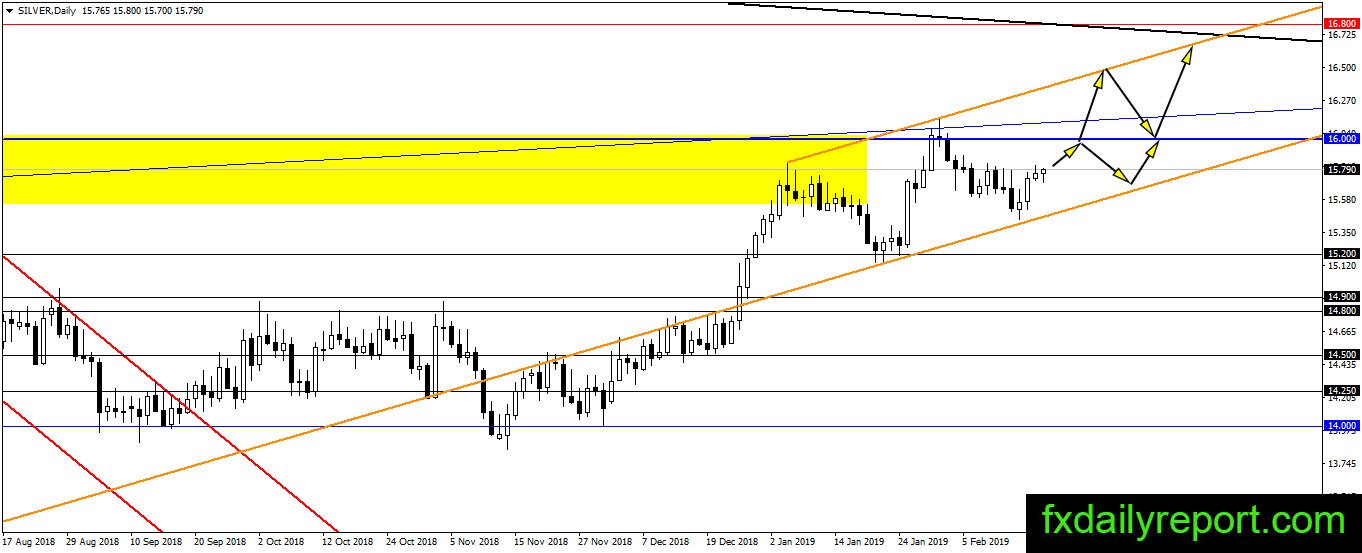
The outlook on the daily chart of silver is bullish and currently looking to test $16.00 resistance again. At the current time, there is nothing traders could do aside from waiting the price hit either $16.00 or the bottom of the channel.
Trade plan
Bullish: Long positions could be taken near the bottom of the channel shown on the daily chart.
Bearish: $16.00 is the level to watch for a long-term short position.