
Silver long-term technical analysis
The upward movement of silver received another reversal in September. The price manages to move as high as $18.18 but closed lower at $16.58 by the end of the month. The reversal is adjacent to the bounce in U.S dollar index which rebound from its fresh yearly low.
Proceeding into October, the bull is in control and start a new rally after U.S Non-farm employment data release. The data show the bigger damage done by hurricane attack in September, job decline 33k versus expectation of 82k increase. Overall, the upward movement looks will continue for the second half of October unless major event happen.

Click here to see previous Silver long-term technical analysis September 2017
Monthly chart
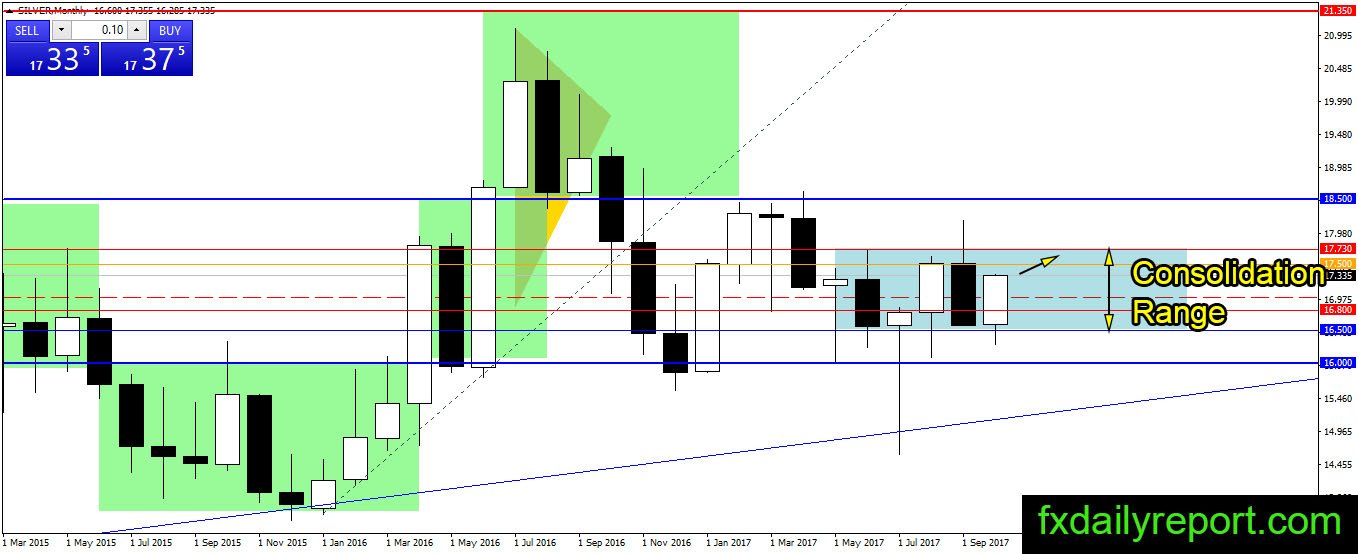
The monthly chart of silver shows the price locked inside the $16.50 – $17.73 range. The price never closes outside of this range, and it is possible the price will continue inside it for weeks or months. Meanwhile, the upward movement might reach $17.73 where traders could look for a short position.
Weekly chart
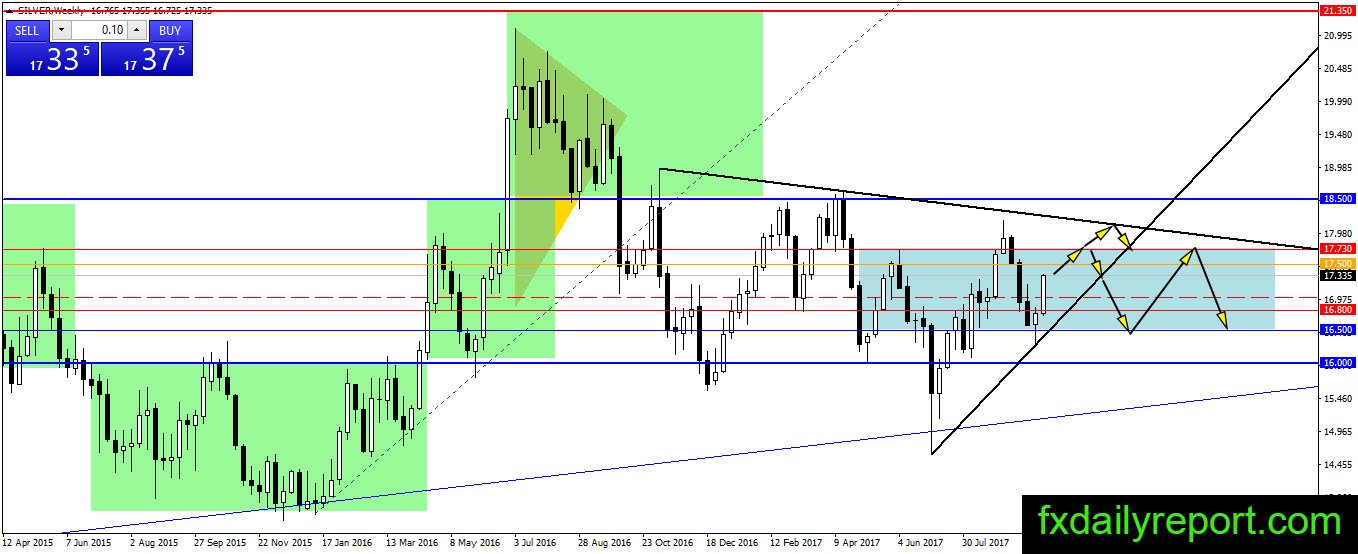
The weekly chart of silver shows a bullish candle close above $16.50 which followed through this week with a move above it. The upward momentum is strong and could easily reach $17.73 next week. On the upside, $17.73 and the down trendline are the resistances to watch.
Daily chart

The daily chart of silver converges with its weekly and monthly chart. The price is on the upward path and riding the strong bullish momentum. $17.50 is the nearest resistance which might reverse the direction.
Trade plan
Bullish: No setup to look yet. Wait until the breakout of $17.73 followed with a successful re-test before placing long position.
Bearish: Potential short area to watch is $17.50 on the daily chart and $17.73 major resistance. Wait until bullish momentum run out of steam before placing short position.