
Silver long-term technical analysis
The bearish pressure on silver is strong and the bull needs to work hard to overturn the current bearish trend. The current situation also unfavorable for U.S dollar opposite as The Fed announced planned rate hike at the end of the year and three more hikes in 2019.
Despite the unfavorable situation, we have first bullish close after three months decline in price. The bullish month also comes after sell-off at the beginning of the month. If the bull could continue to maintain the bullish momentum, we might see the start of the bullish correction phase in silver.

Click here to see previous Silver long-term technical analysis September 2018
Monthly chart
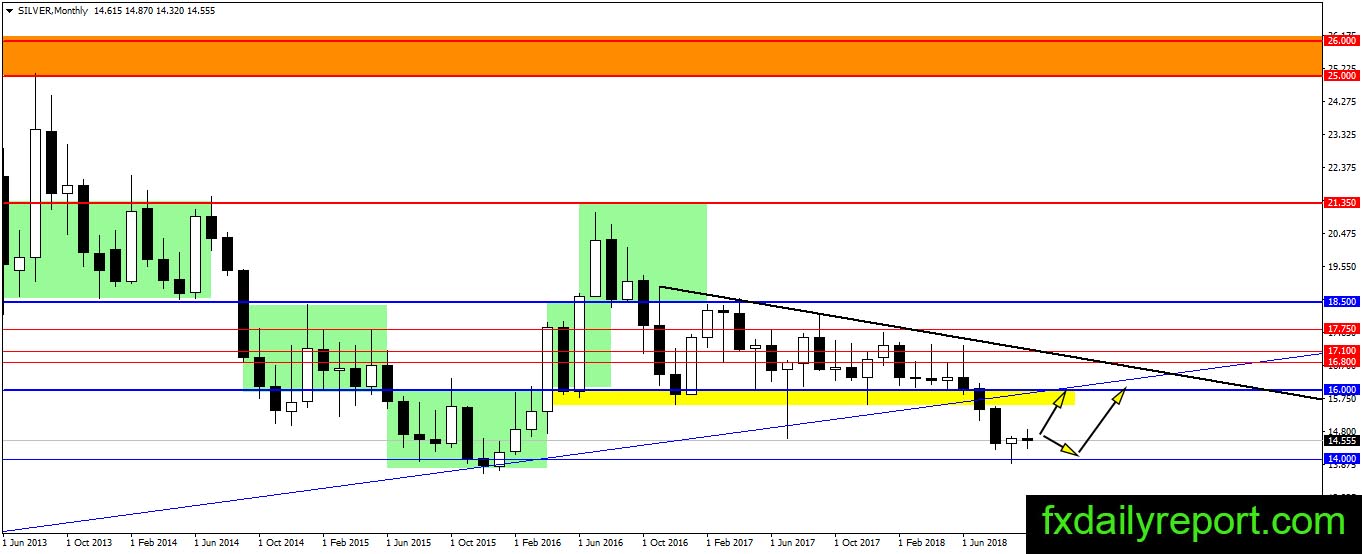
Silver produced a bullish pin bar after the precious metal tested $14.00. It is the first bullish sign since the price fell outside of the triangle pattern on the chart. There is a bullish attempt by the bull early October but no strong momentum seen yet. Although the pair might turn bullish, it still needs a breakout confirmation above the pin this month. If bullish movement happens then silver expected to test $16.00.
Weekly chart
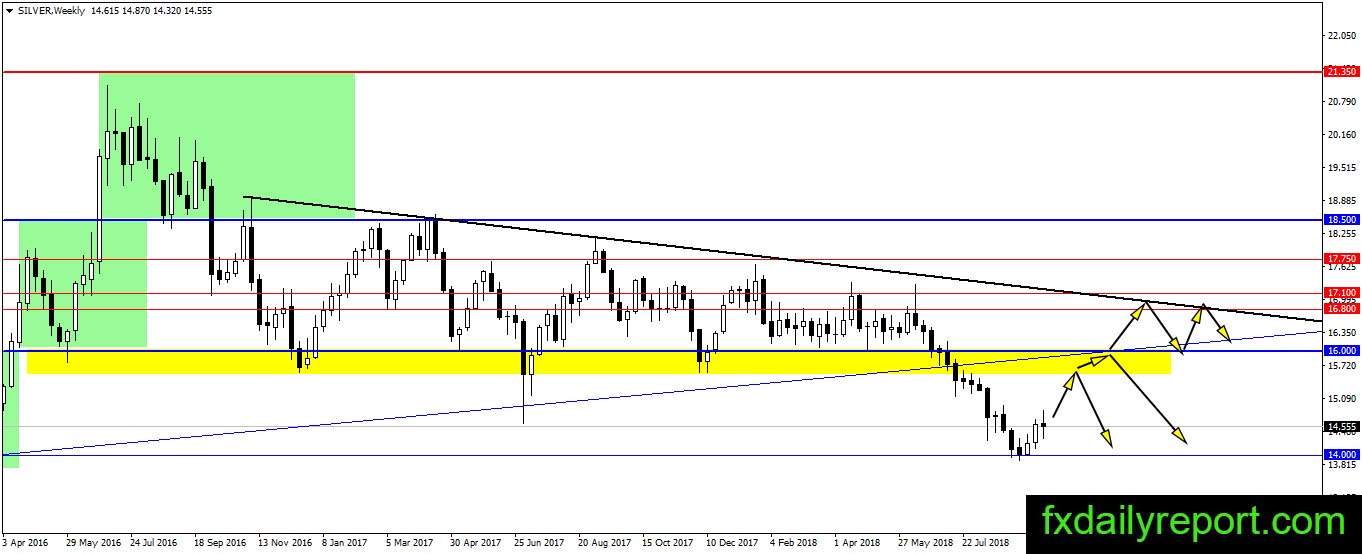
Similar to the monthly chart, silver has upward room for correction toward $16.00. Long position near $14.00 is the best option to ride the correction with small risk. Despite the possibility of bounce, we suggest traders stick to the short side as silver trend still bearish.
Daily chart
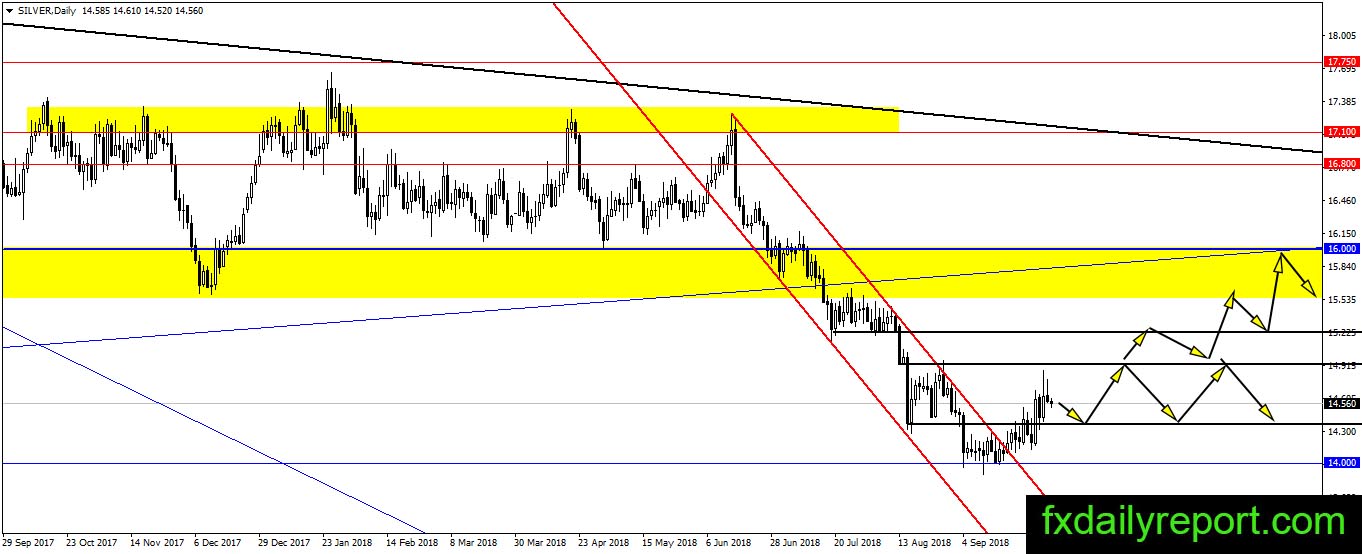
The silver daily chart provides us with several clues when upward correction happen. The price might move zig-zag following the $14.40 – $15.00 – $15.20 – $15.00 – $16.00 pattern. It is the ideal projection and traders could use it as a reference to trade.
Trade plan
Bullish: Long position could be taken near $14.00 support with low risk.
Bearish: Short position could be taken when upward correction happen. The level to watch is $15.00 and $16.00