
U.S dollar index long-term technical analysis
In the previous year, U.S dollar index tumbled hard after it moved past 100 handles. The correction from 100 handles reached as low as 88.25 before the bull return and turned the index up.
The return of bull accompanied by hawkish stance adopted by the Fed. This year, there was three interest-rate hike planned initially. However, resumes economic data gave the market reasons to think the Fed will raise interest-rate more than planned.

Movement of U.S dollar index in April and May is the evidence the bull has gained control and might reclaim at least 50% of 2017 losses.
New Month
Monthly chart
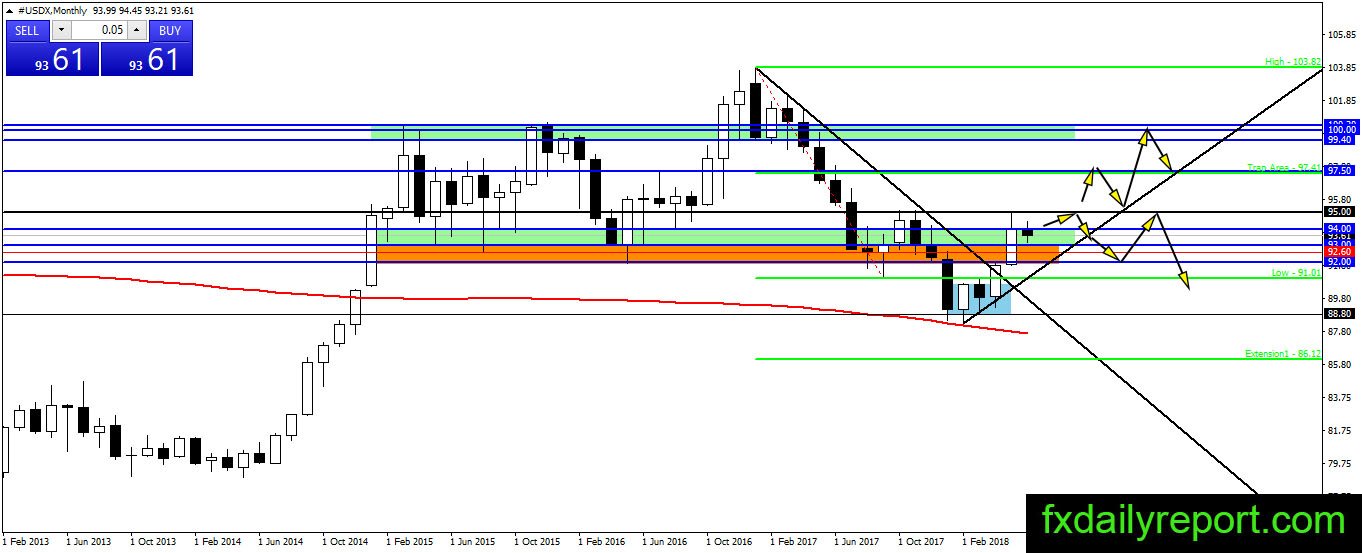
U.S dollar index rallied since the index touched SMA 200 and not looking back again. In the previous month, the bull manages to bring the index to the level near 95.00 which is the correction level before the index resumes its bearish trend. The outlook turned bullish, and the bull only needs one more push above the resistance 95.00 to overturn the trend entirely.
This month is important as there is The Fed interest-rate decision. Will we see a close above 95.00 this month?
Weekly chart

A bearish pin bar formed in the previous week after U.S dollar index reached the WSMA 200. Despite the bearish setup, it looks like the bull could return at any time and drive the index higher. As long as there is no bearish reversal pattern.
Traders who are looking for short position suggested to “wait & see” until further bearish evidence formed.
Daily chart

There is no reason to take a short position in U.S dollar index even though the index is in a correction phase. The nearest support is 93.00 where traders could start looking long position in U.S dollar pair.
Trade plan (For U.S dollar pair)
A long position could be taken when the index reaches 93.00 support level.
A short position needs to wait until another failure at 95.00.