
U.S dollar index long-term technical analysis
The extremely dovish outlook from the Fed in the previous FOMC meeting let the market to believe it is the time for the Fed to cut interest rate. But, latest the Fed meeting decide no rate-hike or rate-cut. Jerome Powell also noted current inflation as Transitory and The Fed will continue to stay patient before moving the rate.
Previously, traders placed 60% odds that the Fed will cut the rate. But after the FOMC meeting, traders set a 50% chance the Fed will cut rate in the future. U.S dollar index turned positive after the news, but it is mostly caused by over pessimism on the trader’s side that cause current movement. Expect sideways movement when the market finishes digesting Jerome Powell speech.
New Month
Monthly chart

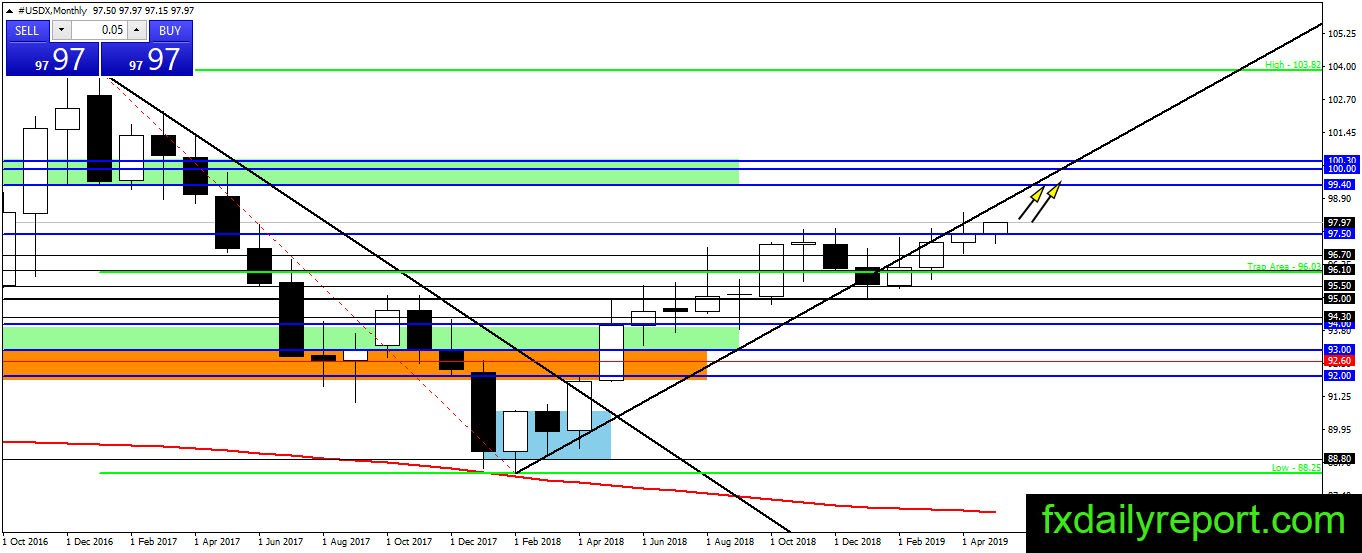
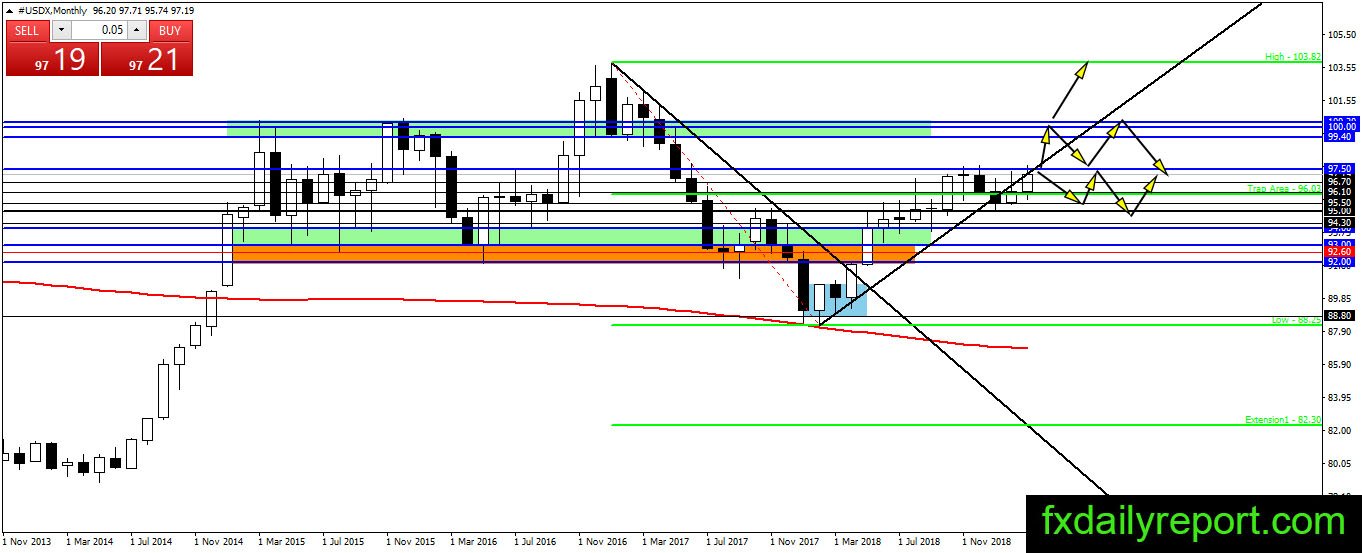
The index is unstoppable after the three-month bullish close. It printed fresh yearly high but the index has not made a close above 97.50 resistance. This month, the index tested 97.50 before rallying. Will we see a close above 97.50 this month to confirm the movement toward 99.40 – 100.00?
Weekly chart
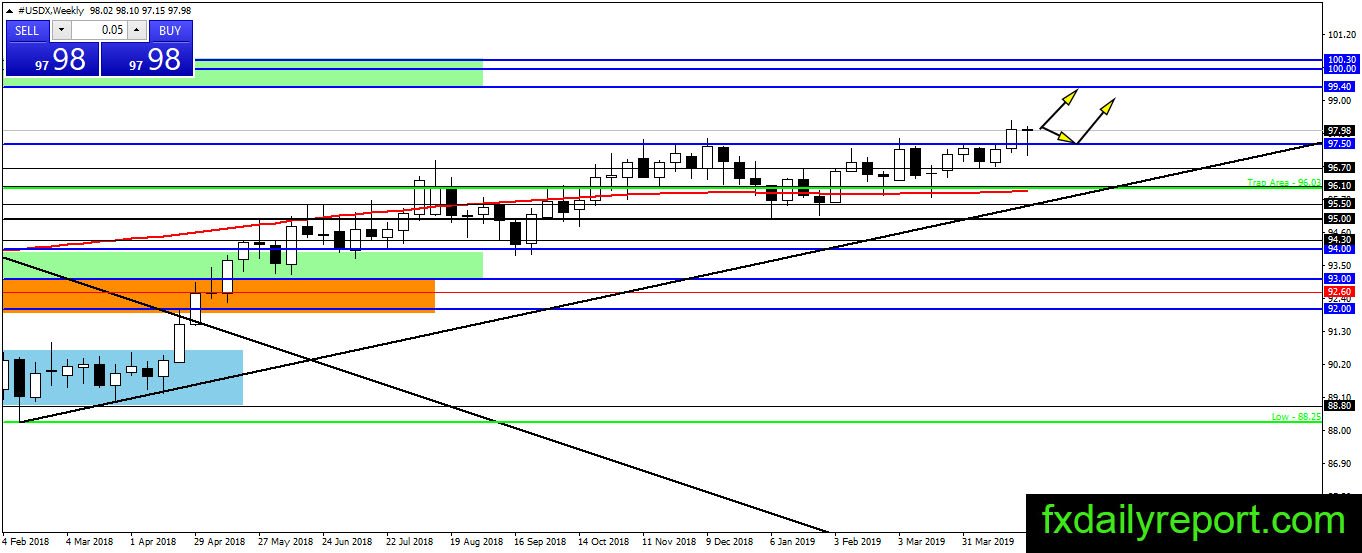
A breakout above 97.50 happened in the previous week and the index has tested the broken level this week. The test results in a bounce and currently the index traded at its weekly opening level. If the bull could maintain the bullish pressure then we will see the index blast above the previous week high and head to 99.40 – 100.00.
Daily chart
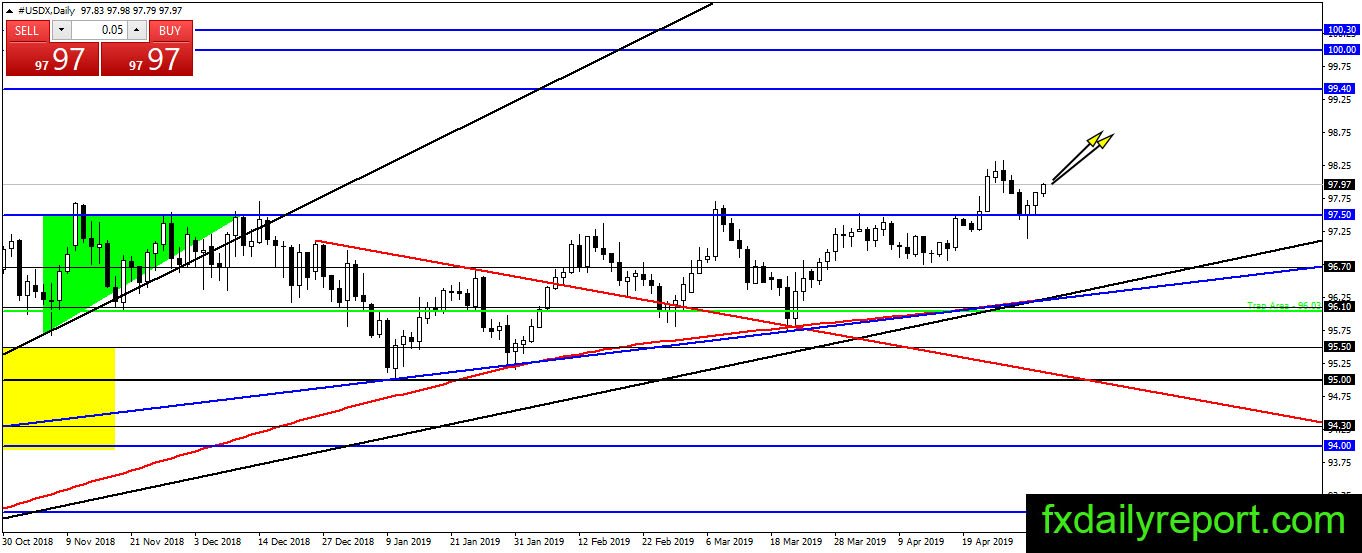
On the daily chart, we have the same outlook as the weekly chart where the index bounce from 97.50. It is a bullish continuation pattern and we should see the index continue further upside.
Trade plan (For U.S dollar pair)
It is time to turn bullish in U.S dollar as the index bounced from 97.50. As long as the index stays above 97.50 then there is no reason to switch to the short side. If traders want to play it safe then wait until the release of U.S job data today.