
U.S dollar index long-term technical analysis
The upward trend of U.S dollar index blasted a new high in August and clear previous year July High. It could mean the index has more room upward. However, the market decided to take a conservative approach before The Fed interest-rate decision on September. Traders and investors expect the Fed will raise interest-rate by 25 bps in September followed by another 25 bps rate-hike in December.
So far the job data released in early September exceeded expectation with 201k job added vs. 191k expected. However, the unemployment rate crept higher to 3.9% vs. 3.8% expectation. Nevertheless, it seems the market geared to more uncertainties in the market and continues buying the dollar.

Trade wars is another issue to put into the hand, recently President Trump mentions the idea to bring trade war to Japan which scares the market. Both combination of the trade war and interest-rate favor U.S dollar strength which suggest traders avoid U.S dollar short positions.
New Month
Monthly chart
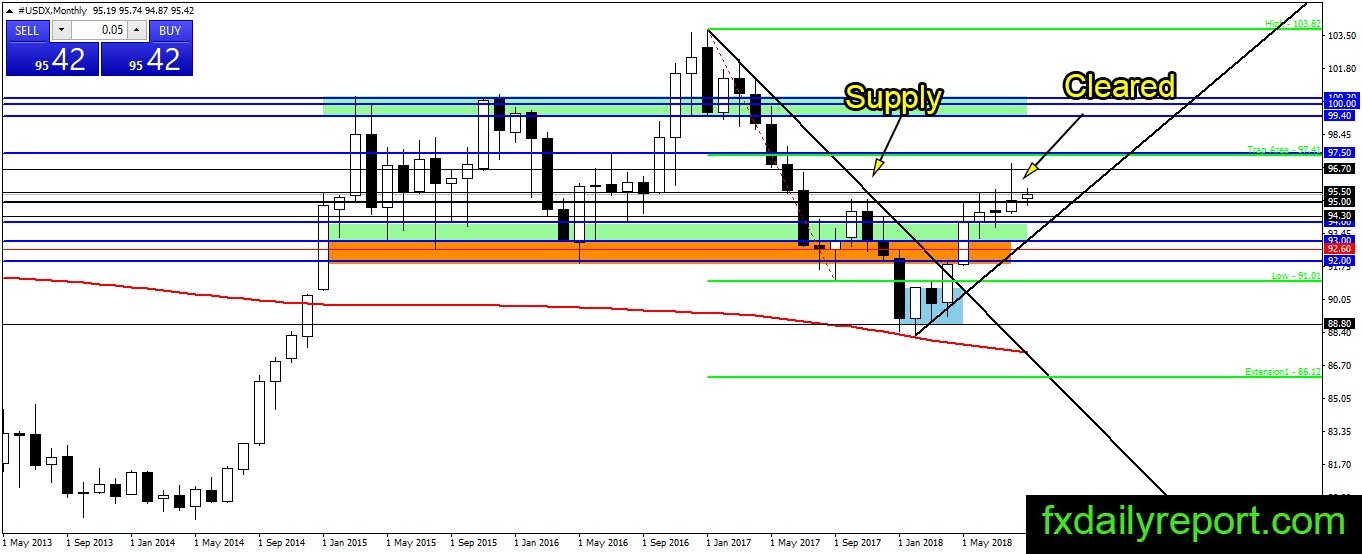
U.S dollar index has trouble to widen the advantage above 95.00. We could see supply level which has been cleared by the bull in August. If the bull continues to push the index upward then we might see higher close in September. A higher close in September will open the path toward 97.50.
Weekly chart
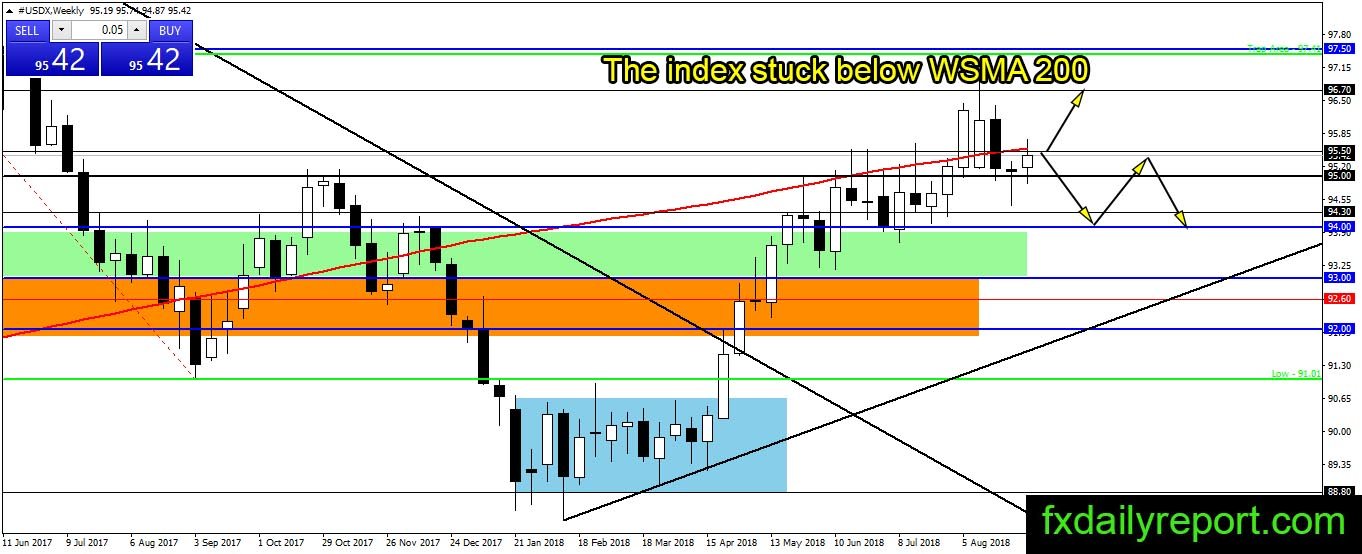
The bullish buildup on the monthly chart is negated by the situation on U.S dollar index weekly chart. The index has trouble to move above the WSMA 200 and continue losing ground near it. If the bull could not close the index above the level soon then it is possible for bearish correction to happen toward 94.00
Daily chart
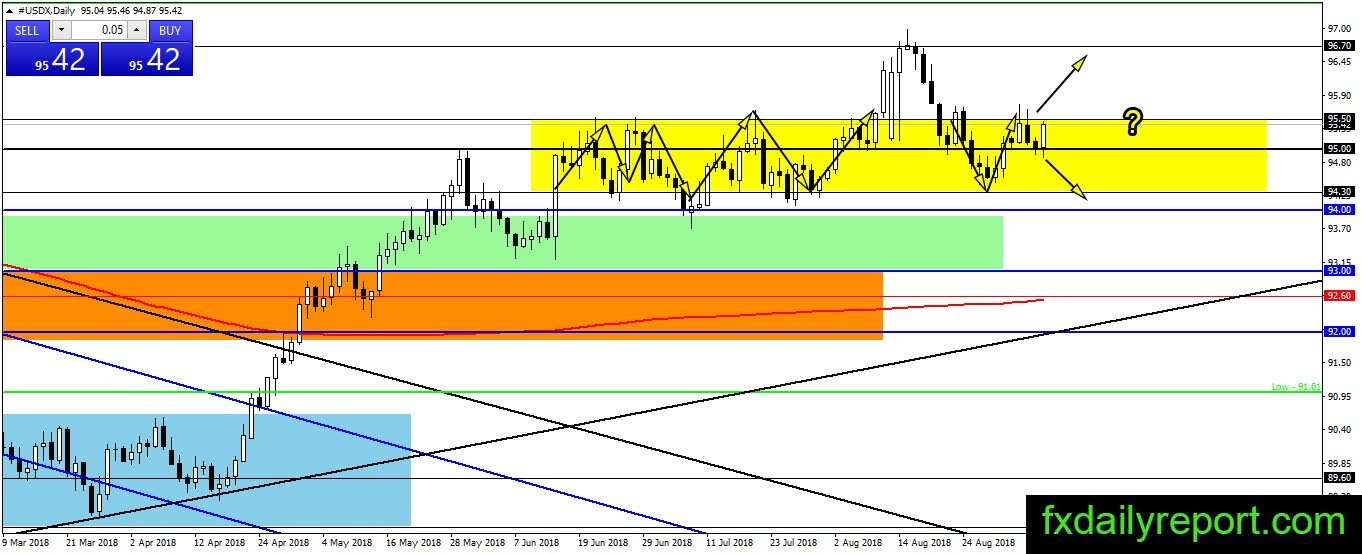
Obvious ranging movement is shown on U.S dollar index daily chart where the index traded inside the yellow box. Only one instance where the index moves out of range and reach 96.70. There is bullish build up on the latest day, will it manage to break above the range or will it continue inside the yellow box?
Trade plan (For U.S dollar pair)
A long position could be taken when the index reaches 94.00 – 94.30 support level.
A short position needs to wait until another failure at 95.00.