
The US Dollar Index (DXY) on Thursday extended the current weekly gains to a new 3-year high of 102.94 following Sunday’s interest rate cut. The USDX has been on a bullish run since March 9, when the coronavirus began to impact a majority of the world including the US.
Since then the DXY has gained 8.66% adding 820 basis points amid risk-off trading. The dollar index has now crossed to overbought levels of the 60-min RSI indicator. This could trigger a pullback in the coming days.
The US Dollar Index Fundamentals Overview

From a fundamental perspective, the US dollar index is trading at the bak of a busy period in the US market. At the start of the week, the US Federal Reserve cut the Funds Rate by 100 basis points to 0.25% down from 1.25% in the previous week. This came hot on the heels of another cut a week earlier that saw the Fed reduce the base interest rate by 50 basis points. Following the two rate cuts this month, the Funds Rate is now down 150 basis points from 1.75 at the start of the month.
Earlier in the week, the US Empire State Manufacturing INdex missed the expectation of 4 with -21.5. Retail sales ex-autos for February also came short of expectations with -0.4% versus the expected (MoM) change of 0.2%. The retail sales control group disappointed with 0.0% versus 0.4% while general retail sales for February missed the (MoM) estimate of 0.2% with -0.5%.
Building permits missed expectations on both counts but housing starts were better than expected. The continuing jobless claims also impressed but the critical initial jobless claims missed 220k with 281k.
The US Dollar Index Technical Analysis (the 60-min Chart)

Technically, the USDX appears to be trading under intense short-term bullish pressure in the market sentiment. The Dollar Index has now crossed over to overbought levels of the 60-min RSI. This could trigger a short-term pullback.
Therefore, the bears will be targeting pullback profits at around 102.38 or lower at 101.96. On the other hand, the bulls will look to extend gains towards 103.30 or higher at 103.70.
The US Dollar Index Technical Analysis (the Daily Chart)
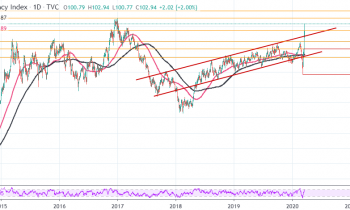
In the daily chart, the US dollar index appears to have recently made a sharp bullish breakout off a gently ascending channel. This shows a spike in the market sentiment triggered by the bulls. The USDX is now close to crossing to overbought levels of the daily RSI. This could trigger a pullback.
Therefore, the bears will target long-term pullback profits at around 100.09 or lower at 98.82. On the other hand, the bulls will look to pounce for profits ta around 103.86 or higher at 105.07.