
The US dollar currency index (DXY) on Monday opened below the 100-hour SMA amid a lack of upward momentum. The USDX continues to struggle to breach the resistance level despite bouncing off weekly lows of 89.98 earlier on.
The dollar index also appears to be pinned within a slightly descending channel formation in the 60-min chart. It continues to trade centrally in the 14-hour RSI following the rebound. There is limited room for upward movement.
The US Dollar Index Fundamentals Overview

The US dollar currency index appears to be lacking the fundamental backing to drive it higher despite a recent rebound. News about the new US stimulus package of $900 billion slightly increased market activity, but the festivities have halted any momentum gained from it. The coronavirus pandemic also continues to ravage global economics and the US is not an exception. However, the recent roll-out of the coronavirus vaccine appears to be helping to level the adversity of the pandemic on the economy.
The earnings season for Q4 could provide some market momentum at the start of next year with several companies expected to announce results within the first few weeks. President-elect Joe Biden’s inauguration on January 20 could also shake up the dollar index amid increased market optimism. The US non-farm payrolls for December and the ISM PMIs will also be out next week. This could provide more upside potential for the USDX. Traders will be watching Tuesday’s S&P/Case-Shiller Home Price Indices for signals of potentially market-boosting data.
The US Dollar Index Technical Analysis (the 60-min Chart)
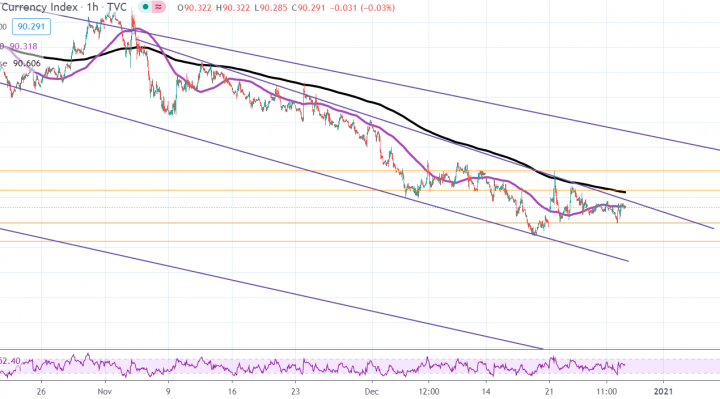
Technically, the USDX appears to be trading within a slightly descending channel formation in the 60-min chart. This indicates a slight short-term bearish bias in the market sentiment.
The bulls will be targeting short-term recovery profits at around 90.64 or higher at 91.03. On the other hand, the bears will look to extend the current short-term declines towards 89.98 or lower to 89.62.
The US Dollar Index Technical Analysis (the Daily Chart)
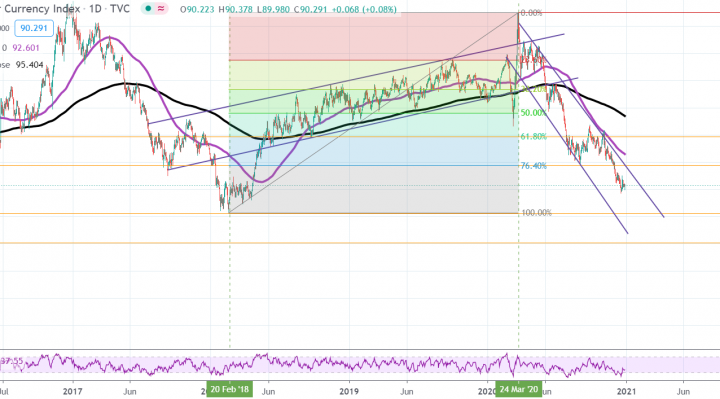
In the daily chart, the US dollar index appears to be trading within a sharply falling channel formation. This indicates strong long-term bearish pressure in the market sentiment. It is now pinned between the 76.40% and 100.00% fib levels.
The bulls will target long-term profits at around 76.40% and 61.80% fib levels at 91.75 and 93.85, respectively. On the other hand, the bears will target profits at the 100% fib level at 88.22 or lower at 86.04.