
Natural gas surged higher after breaking above its ascending channel, with price spiking to a high near $2.874 before easing back to the $2.796 area. This pullback could be a healthy pause that allows the market to attract fresh buyers before any further advance.
The Fibonacci retracement tool highlights likely support levels drawn from the recent swing low near $2.640 to the high at $2.874. The 38.2% Fib lines up with current price around $2.785, while the 50% level sits at $2.757.

A deeper correction could reach the 61.8% Fib at $2.729, which is close to the channel’s midline and could serve as a stronger area of interest for dip buyers.
If any of these Fibonacci levels hold as support, natural gas could resume its climb and set its sights back on the recent highs near $2.874 or higher, especially if the breakout from the ascending channel proves to be sustained. A failure to hold these levels, however, could mean a slide back toward the channel bottom or the swing low around $2.640.
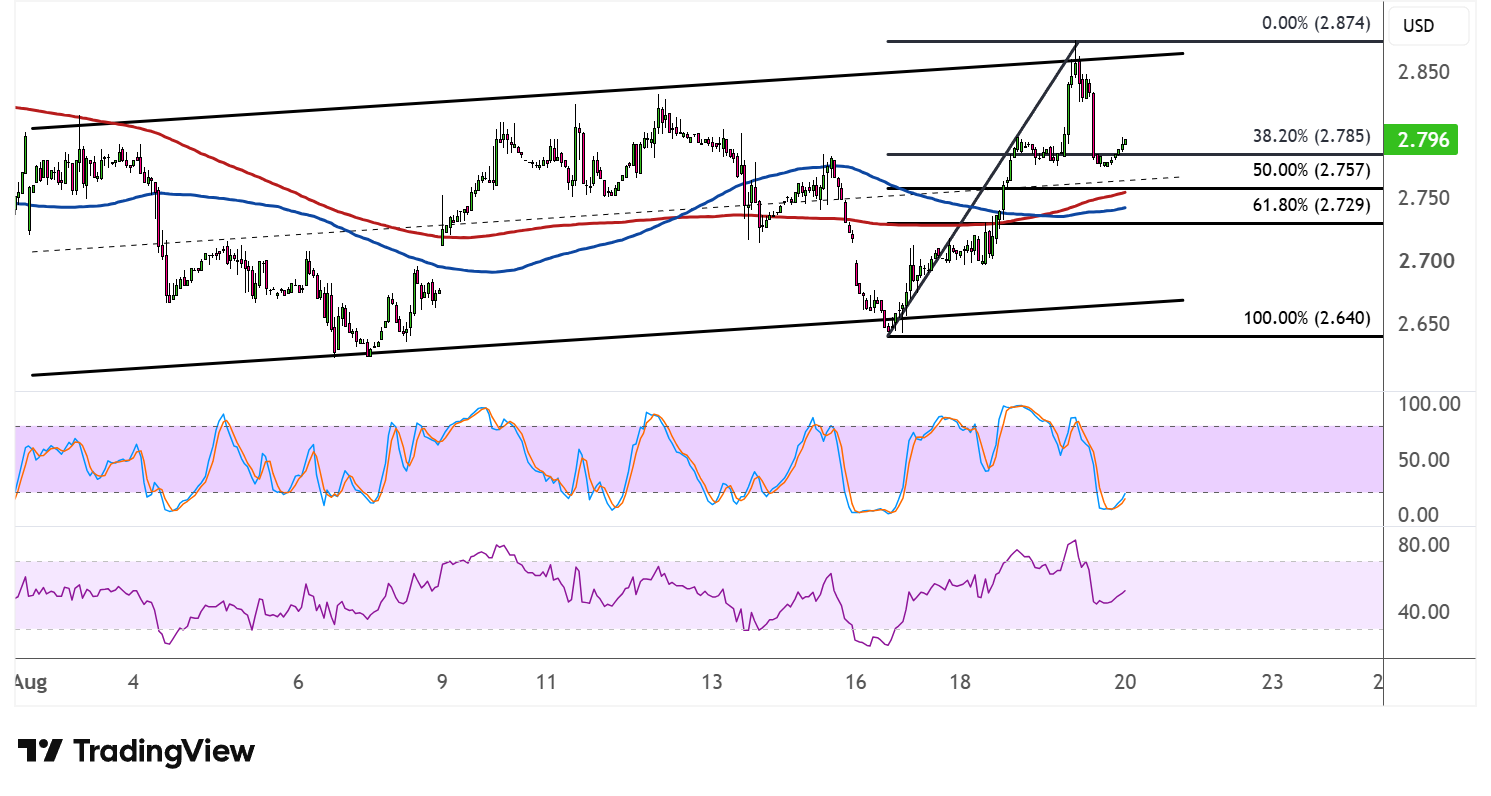
Looking at the moving averages, the 100 SMA has crossed above the 200 SMA, reflecting a shift in momentum favoring the bulls, and price is currently trading above both indicators. This could mean that the moving averages start to serve as dynamic support on any pullback, reinforcing the case for buyers stepping back in.
Stochastic has pulled back sharply from the overbought region and is hovering closer to the midpoint, suggesting that bearish pressure has crept in but hasn’t reached exhaustion just yet. This leaves some room for the correction to continue before buyers regain full control.
RSI is also on the retreat from overbought territory and has some room left to fall before reaching oversold conditions, which means price could keep drifting lower in the near term while sellers stay in the driver’s seat. Still, as long as the broader ascending structure remains intact, dips could continue to draw in buying interest.