
The Bitcoin-to-gold ratio has formed its 5th hidden bullish divergence. According to macro strategist Gert van Lagen, this is a potential breakout signal. The analyst has highlighted the recurring technical pattern in his tweet on X. Along with the analysis, he shared a long-term TradingView chart covering the BTC/GOLD ratio from 2011 through 2026.

Bitcoin/Gold Ratio Signals Potential Higher High

Van Lagen has pointed to a recurring setup in which $BTC forms a higher low against gold. Meanwhile, the Relative Strength Index (RSI) records a lower low. Historically, the pattern has been followed by a break above the ratio’s declining trendline and a subsequent higher high.
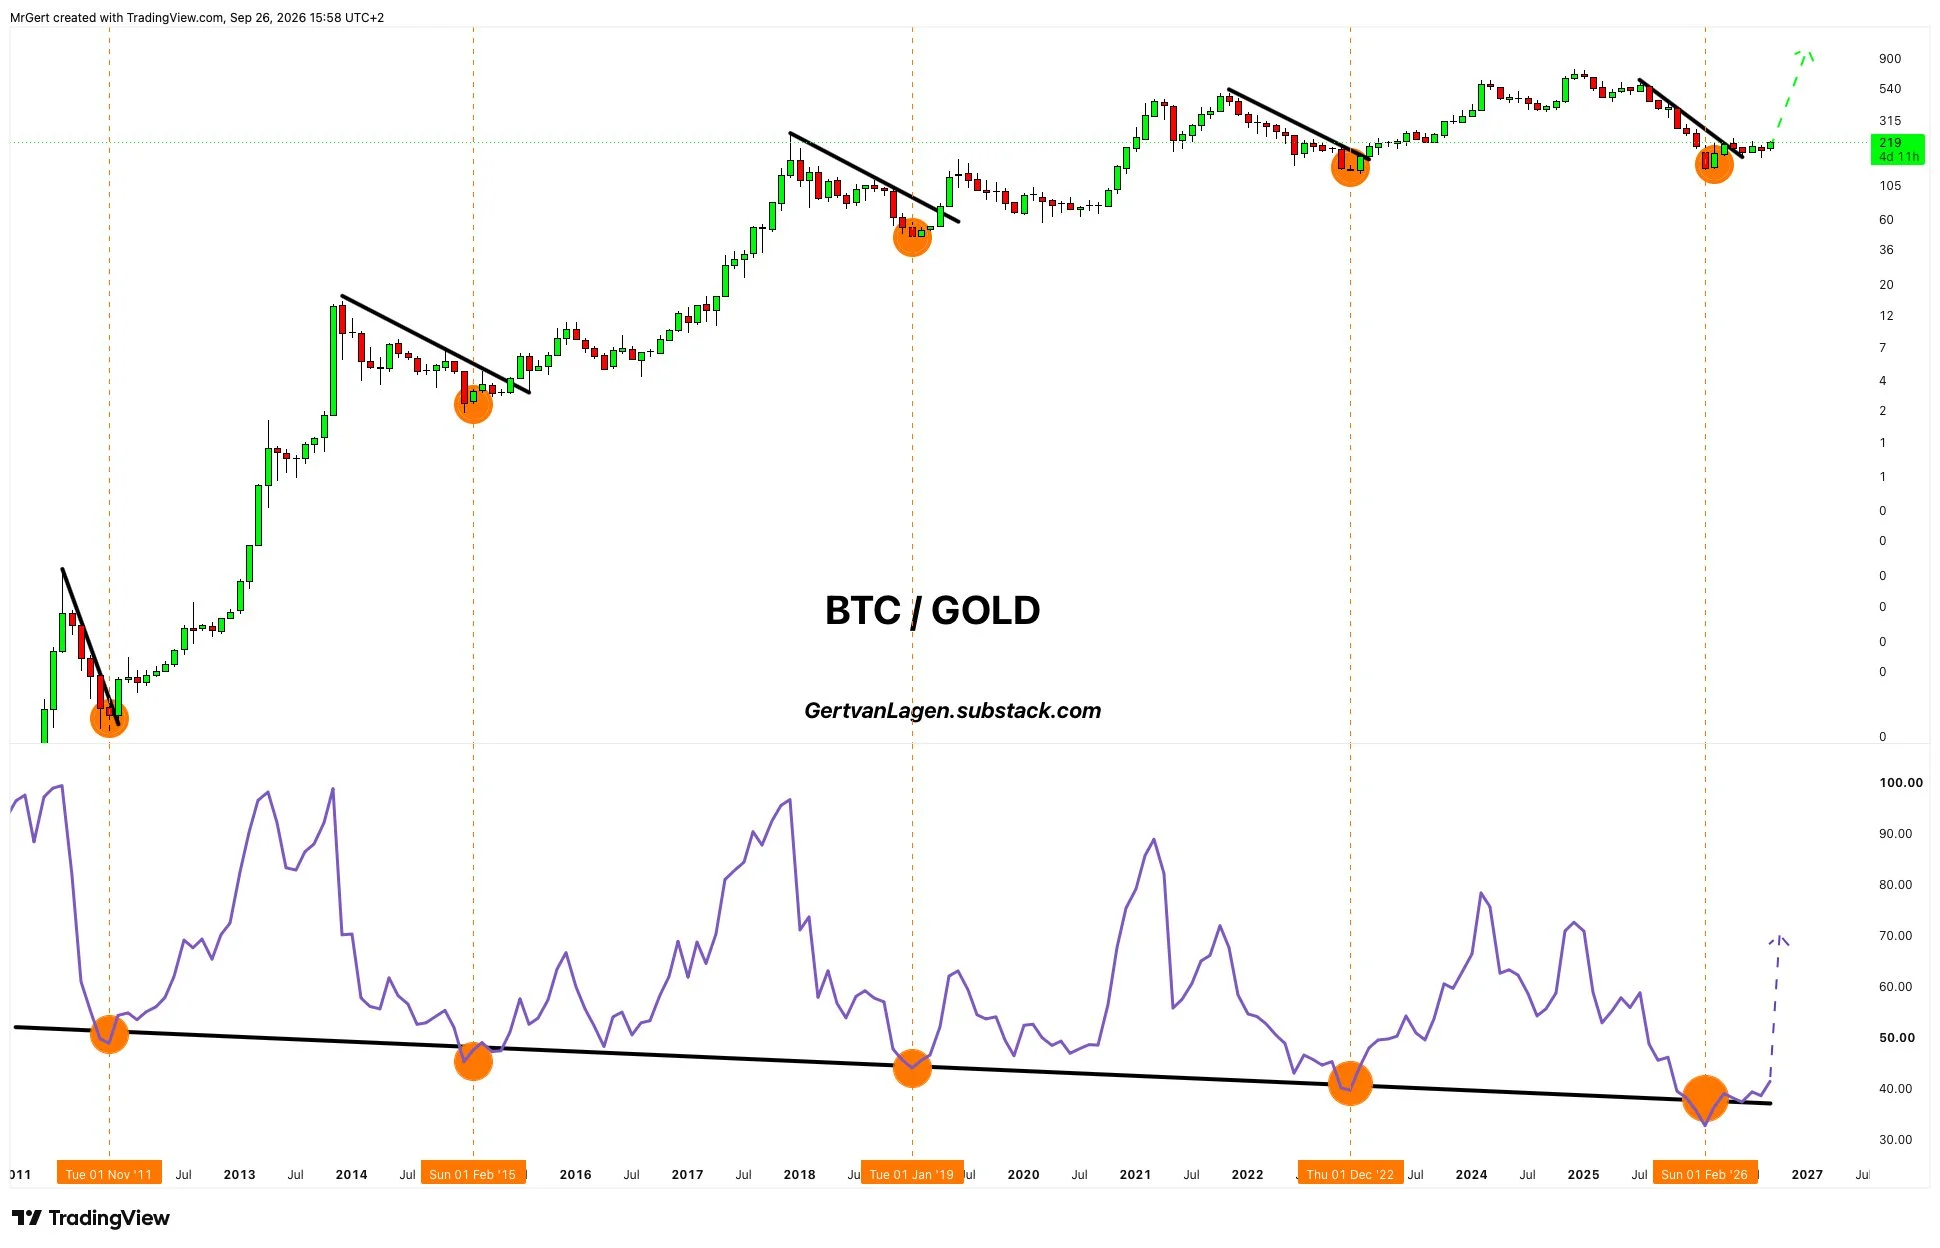
According to van Lagen, the BTC/GOLD ratio is currently in the third stage of the respective sequence. The downtrend being challenged. He suggested that the setup could precede another higher high.
The chart shard by Van Lagen marks similar patterns around Bitcoin market bottoms in 2011, 2015, 2018, and 2022. The latest divergence appeared in early 2026. Van Lagen also referenced a December 2025 post in which he had identified that the BTC/GOLD RSI trendline is being tested.
BTC/GOLD Ratio Climbs Toward 20 Ounces
The BTC/GOLD ratio measures how many ounces of gold are equivalent to the price of one Bitcoin. As of September 26, the ratio stood at roughly 19.6 ounces. It has recovered from a low of near 12 ounces earlier this. Despite the recovery, the ratio remains significantly below its historical peak of more than 40 ounces. Bitcoin is trading in the mid-$80,000 range in recent days. On the other hand, gold is trading around $4,300–$4,400 per ounce.
The ratio is commonly used to compare Bitcoin’s relative performance with gold. An increase indicates that Bitcoin is gaining value while a decline shows stronger relative performance from gold.
Van Lagen’s latest observation is based on technical patterns rather than a fundamental forecast. Similar formations in previous cycles do not guarantee the same outcome this cycle. Bitcoin and gold remain sensitive to interest rates, liquidity conditions, and demand. It is advised not to consider this article as an investment advice.