
On Friday, the gold price bounced back from the session lows of about $4,253 to trade at about $4,288 after the latest data. XAU/USD trades within a descending channel formation on the 60-minute chart.
The price of the yellow metal continues to trade slightly below the 100-hour moving average line, despite the rebound. As a result, there is still some room left to run before reaching the overbought levels of the 14-hour RSI.
Gold Price Fundamentals Overview

From a fundamental perspective, XAU/USD trades during a relatively busy period in the US market. On Friday, the US durable goods orders for August outperformed expectations of -0.4%, with a change of 0%. The durable goods orders ex-transportation for the period fell short of 0.6%, with a change of 0.3%. On the other hand, the US nondefense capital goods orders ex-aircraft outshone the forecast of 0.5%, with a change of 1.6%.
Elsewhere, the Michigan Consumer Sentiment Index for September outperformed the expectation of 47.6, with a reading of 48.1, up from the previous month’s equivalent of 47.8. On the other hand, the UoM 1-year consumer inflation expectation for the month was in line with the estimate of 4.6%, unchanged from August. The UoM 5-year consumer inflation expectations for the period also remained unchanged at 3.4%, as expected.
Earlier in the week, the preliminary S&P Global Manufacturing PMI for September outpeformed the expected reading of 53.5, with a reading of 57. The preliminary S&P Global Services PMI for the period also beat 56, with a reading of 58.7. Elsewhere, the initial jobless claims for last week fell to 197k, down from 198k in the preceding week, beating the forecast claim count of 201k.
Gold Price Technical Analysis (the 60-min Chart)
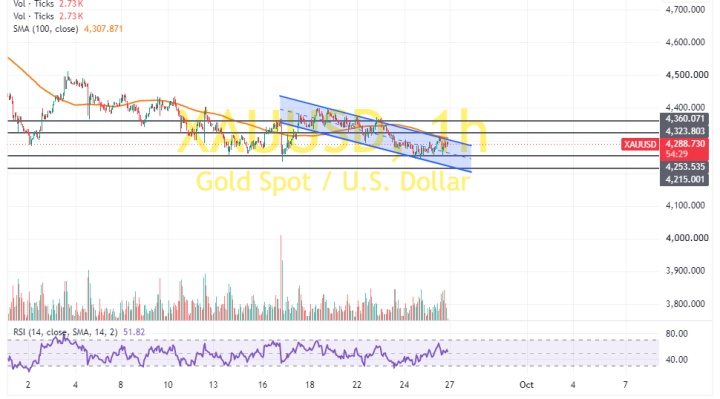
Technically, the gold price trades within a descending channel formation on the 60-minute chart. However, the 14-hour RSI has recently bounced back to avoid falling into oversold conditions.
Therefore, the bulls will look to stretch the latest rebound towards $4,323 or higher, to $4,360. On the other hand, the bears will look to pounce on profits at about $4,253 or lower, at $4,215.
Gold Price Technical Analysis (the Daily Chart)
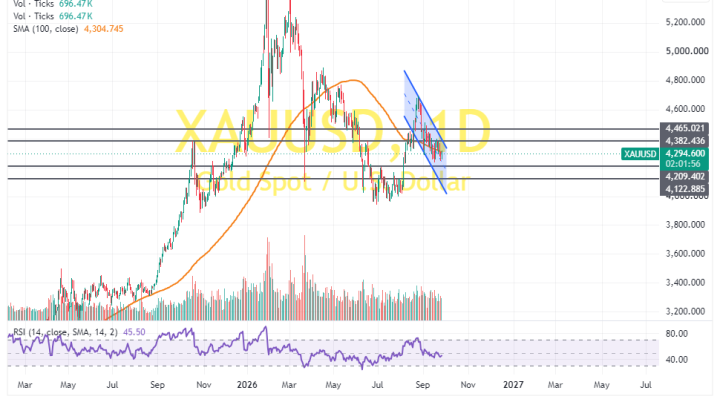
In the daily chart, the price of the yellow metal trades within a descending channel formation. The 14-day RSI also supports a bearish bias as it edges closer to oversold conditions.
Therefore, the bears will look to stretch the current pullback towards $4,209 or lower, to $4,122. On the other hand, the bulls will look to pounce on rebounds at about $4,382 or higher, up to $4,465.