
The US dollar index on Friday ended lower from yesterday’s close following the release of the latest US economic data. The USDX has been trading in a gently ascending channel since bottoming at around 98.80 on April 15.
The dollar index is now pinned just below the current level of the 100-hour SMA in the 60-min chart while the 200-hour SMA is a few levels lower. The USDX also appears to be trending lower towards the oversold levels of the 14-hour RSI.
The US Dollar Index Fundamentals Overview

From a fundamental perspective, the US dollar index is trading at the back of a mixed period in the US economy. The government continues to make progress in its measures to mitigate the adverse economic effects of the coronavirus pandemic. However, the latest round of economic data does not fully reflect this. There are some sections of the economy that are yet to respond to the stimulus package program.
On Tuesday, the US existing home sales for March missed the (MoM0 expectation of 5.3M with 5.27M. On Wednesday, the house price index for Feb. beat the (MoM) expectation of 0.3% with 0.7% while the initial jobless claims continued to disappoint on Thursday.
On Friday, non-defense capital goods orders ex-aircraft beat the expectation of -6% with 0.1% durable goods orders ex-transportation impressed with -0.2% versus -5.8%. On the other hand, general durable goods orders disappointed with -14.4 versus -11.9.
The US Dollar Index Technical Analysis (the 60-min Chart)
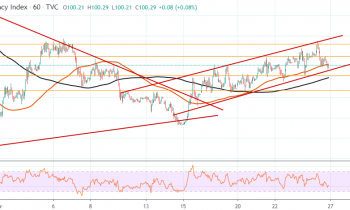
Technically, the US Dollar Index appears to be trading within a gently ascending channel in the 60-min chart. This indicates a short-term bullish bias in the market sentiment. The USDX is has dropped below the 100-hour SMA. This could push it lower despite the trendline support.
The bears will be looking to pounce on the short-term weakness of the USDX bu targeting profits at around 100.03 or lower at 99.68. On the other hand, the bulls will target rebound profits at 100.51 or higher at 100.81.
The US Dollar Index Technical Analysis (the Daily Chart)
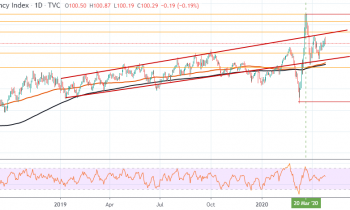
In the daily chart, the US dollar index appears to have recently bounced off the trendline support. It continues to trade in a gently rising channel amid a long-term bullish bias.
The bulls will be looking to extend the current gains towards 101.31 or higher at 102.27. On the other hand, the bears will look to pounce at around 99.36 or lower at 98.01.