
The US Dollar Index (DXY) on Wednesday pulled back to trade at about 97.90 shortly after setting a new weekly high of about 98.00 amid a resurfacing of US-China trade tensions. The USDX appears to have returned to trade in a previous descending wedge after completing a double-bottom reversal pattern.
Following today’s pullback, the Dollar Index has now returned to trade centrally in the RSI indicator of the go-min chart. The DXY also recently bounced off 2-week lows of about 97.75.
The US Dollar Index Fundamentals Overview

From a fundamental perspective, the USDX is trading at the back of a relatively inactive period in terms of economic data. The most significant development this week came from President Trump’s comments about China’s plans to boycott trade talks. Trump warned that if China walks out of the trade talks, then the US government will impose new trade tariffs on Chinese goods.
The latest economic data did not provide an impetus for a major rally in the US Dollar Index. On Monday, the 3-month and the 6-month bill auction rates edged lower form 1.565% and 1.55%, respectively to retail at 1.54% and 1.54%. Total Net TIC Flows for September missed the expectation of $35.9B with $-37.6B while Net long-term TIC Flows beat $20.4B with $49.5B.
And on Tuesday, Housing Starts for October lightly missed expectations while Building Permits beat convincingly.
The US Dollar Index Technical Analysis (the 60-min Chart)
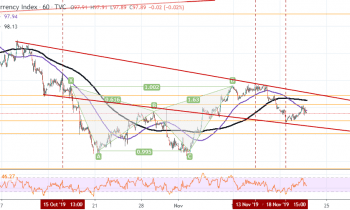
Technically, the US Dollar Index appears to be experiencing a short-term bearish pressure after recently completing a XABCD double-bottom reversal pattern. The USDX has since returned to the normal trading zone of the RSI indicator and hangs just below the 100-hour SMA.
This indicates a bearish pressure in the market sentiment, which creates short-term bearish opportunities at around 97.75 or lower at 97.50. On the other hand, the bulls will be hoping for a quick rebound towards 98.00 or higher at 98.20.
The US Dollar Index Technical Analysis (the Daily Chart)
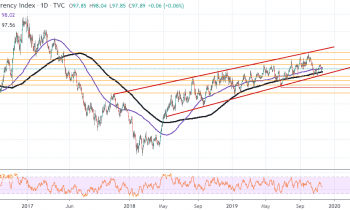
In the daily chart, the US Dollar Index (DXY) appears to be trading in an ascending channel, which indicates a long-term bullish bias in the market sentiment. The USDX is firmly positioned between the 100-day and the 200-day SMA lines and this supports a continuation of the current trend.
Therefore, the bulls will be targeting long-term profits at around 98.36, 98.99 or higher at 99.73. On the other hand, the bears will hope for major bearish reversal towards 97.09, 96.63, or lower at 96.10.