
On Friday, the US dollar index extended Thursday’s rebound from the current weekly lows of about 98.69 to trade at about 100.35. The DXY trades within an ascending channel formation in the 60-minute chart.
The dollar currency index has now advanced to trade a few levels above the 100-hour moving average line. As a result, the USDX has since entered the overbought levels of the 14-hour RSI.
The US Dollar Index Fundamentals Overview

From a fundamental perspective, the US dollar currency index trades during a relatively busy period in the US market. On Friday, the preliminary annualized US gross domestic product for Q4 missed the expected change of 1.4%, with a change of 0.7%. The preliminary Michigan Consumer Sentiment Index for March came in better than expected, with 55.5 versus a forecast of 55.
On the other hand, personal consumption expenditures – price index for January missed the expected (YoY) change of 2.9%, with a change of 2.8%. The (MoM) equivalent matched the expectation of 0.3%. The core personal consumption expenditures – price index for the period also matched the forecasted (MoM) and (YoY) changes of 0.4% and 3.1%, respectively.
Elsewhere, personal income for January missed the expected change of 0.5%, with a change of 0.4%, while personal income outshone the estimate of 0.3%, with a 0.4%. The JOLTS Job Openings for January also exceeded the expectation of 6.7 million, with a tally of 6.946 million, up from 6.55 million in December.
The US Dollar Index Technical Analysis (the 60-min Chart)
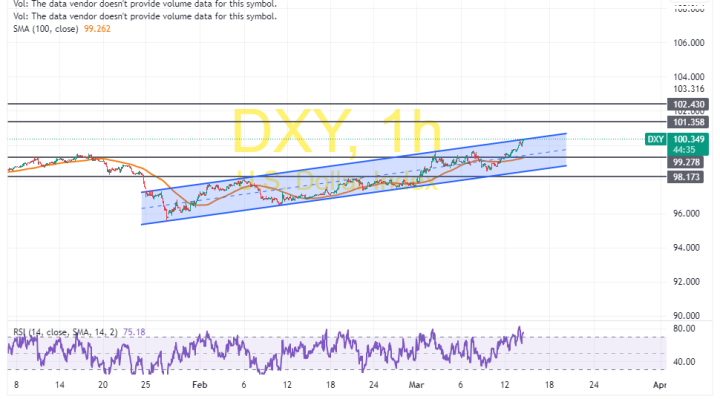
Technically, the US dollar index trades within an ascending channel formation in the 60-minute chart. The 14-hour RSI also supports a bullish bias after entering overbought conditions.
Therefore, the bulls will look to ride the current run of gains toward 101.35 or higher to 102.43. On the other hand, the bears will look to pounce on profits at about 99.27 or lower at 98.17.
The US Dollar Index Technical Analysis (the Daily Chart)
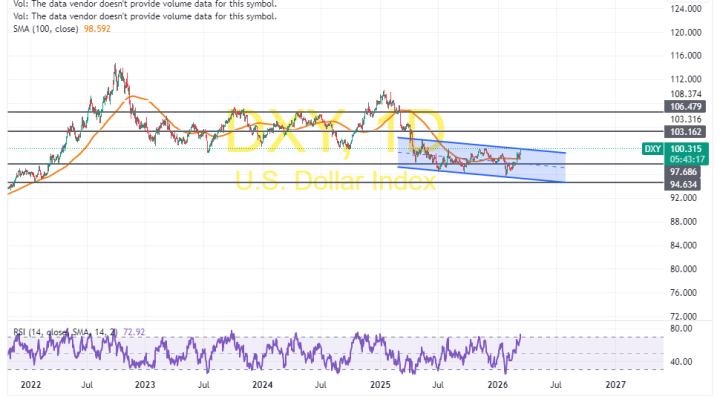
In the daily chart, the US dollar currency index trades within a descending channel formation. However, the 14-day RSI has recently bounced back to recover from oversold conditions.
Therefore, the bulls will look to stretch the latest rebound towards 103.16 or higher to 106.48. On the other hand, the bears will look to pounce on pullbacks at about 97.68 or lower at 94.63.