
Global market shrugged-off N.Korea fear
The bearish sentiment from North Korea missile strike announcement rattle stock market in the previous week. However, as soon as the market open today, traders and investors overlook the issue and brought indices across the world to positive.
Nikkei down 192.64 points (-0.98%) to 19,537.10, Shang Hai Composite up 28.39 points (+0.88%) to 3,236.93, and Australia ASX 200 up 37.27 points (0.65%) to 5,73041. Meanwhile, stock market in Europe also follow Asian lead with DAX Germany, FTSE UK, Euro STOXX 600 up 1.19%, 0.61%, 0.87% respectively.

U.S stock market poised for gain as DJIA futures pointed up 88 points and aiming for triple digit before the market open.
Earnings & Corporate report
JD.com (NASDAQ: JD) reported 43.6% increase in revenue compared to previous year, higher than analyst expectation. The company reported Q2 revenue of 93.2 billion yuan ($13.98 billion) vs. 89.3 billion yuan expectation.
Technical Analysis
Dow Jones Industrial Averages (INDU)
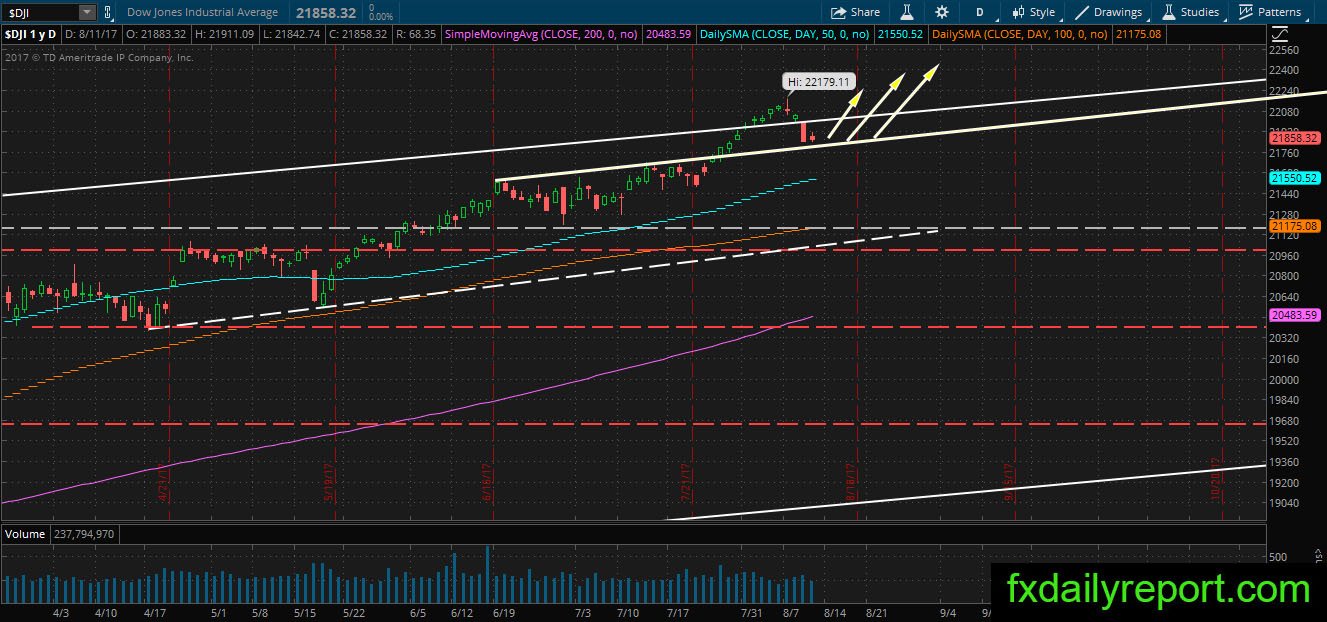
DJIA setup for gain today as the futures pointed up. Recent drop from N.Korea rising missile strike threat subsides, and global market once again set attention to the economic data. DJIA today might be able to retain 22,000 handles as there are few major news releases until FOMC meeting minutes Wednesday.
Amazon Inc (AMZN)
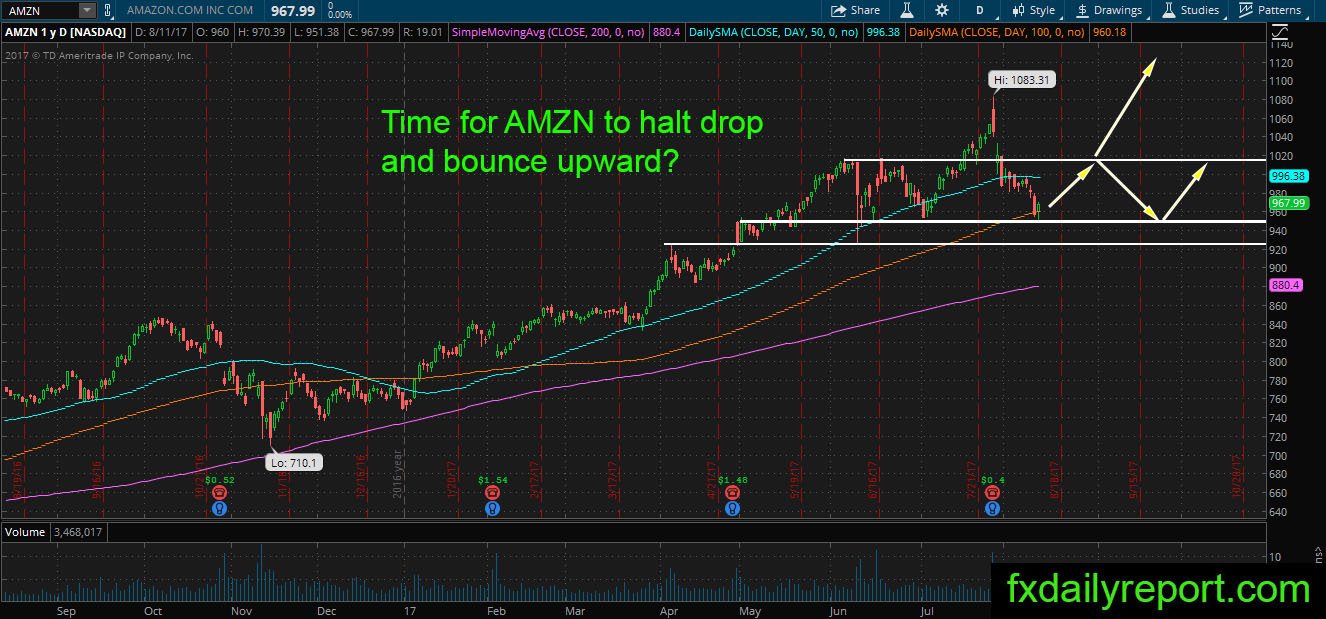
AMZN is one of the most seeks out blue chip stock which currently pulling back from the top after earnings dismal. The earnings result although low, and it shows the aggressive company expansion to grab the future opportunity. The shares are moving at the daily SMA 100 and previous support around $950. Traders could look for the long position from this level with a tight stop.
If price decides to continue its descent, the bull might come out near the daily SMA 200.
FedEx (FDX)
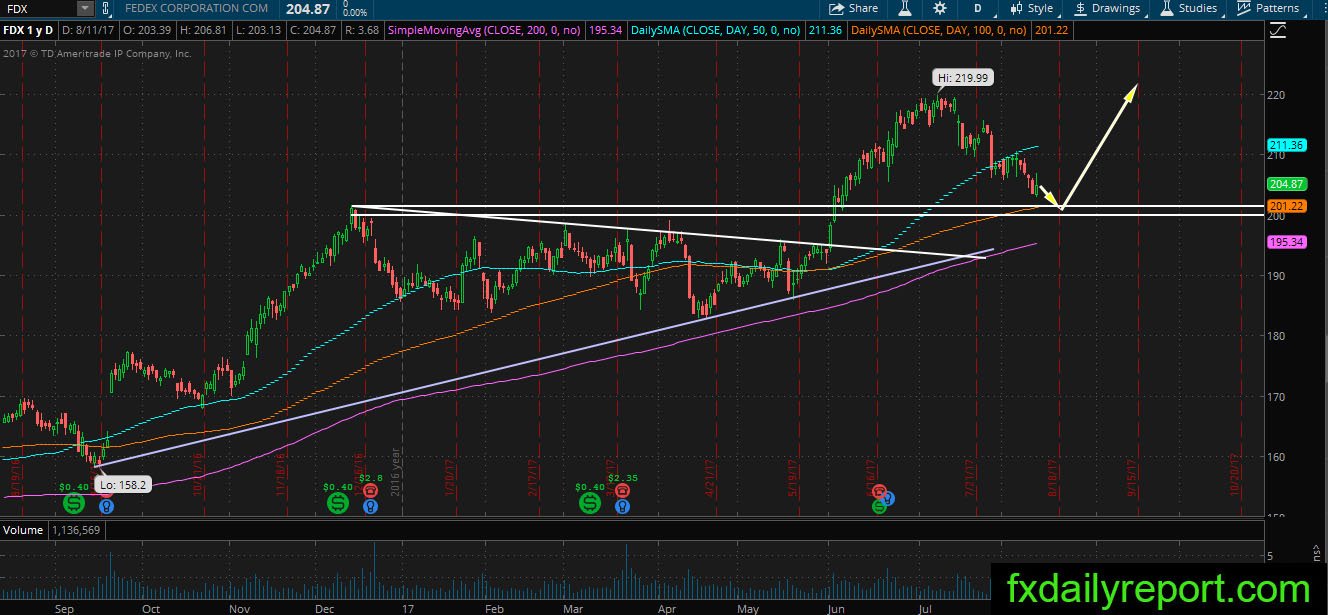
FDX share prices retreat slowly from the top and continue below the daily SMA 50. There is a possible long opportunity near the daily SMA 100 and support between $200 – $201. Look for price reaction and place long position with a stop below the daily SMA 200.
Other watch lists
MSFT – bullish engulfing pattern from the daily SMA 50, might continue upward to reach $74.42 high.
LYB, HAS, BBRY – The price getting near to the daily SMA 200, might bounce upward after the test.
CRM – Initial bounce from the daily SMA 100
DAL – Bullish pin bar from the daily SMA 200, if confirmed by higher close today, it might bounce upward.
PRU – The price hit daily SMA 200 from above, the bearish momentum is strong and might break lower. Observe the price reaction.
WDC – Bullish harami pattern at the daily SMA 200, wait for break confirmation.