
Re-Growing tension on Korean Peninsula
Asian stock market and European stock market thread lower on renewed tension on the Korean Peninsula. The tension increase on North Korea objection as U.S and South Korea decided to start the military drill.
Nikkei down 77.28 points (-0.40%) to 19,393.13, Shang Hai Composite up 18.60 points (+0.57%) to 3,287.32, and Australia ASX 200 down 21.26 points (0.37%) to 5,725.85. Meanwhile, stock market in Europe also follow Asian lead with DAX Germany, FTSE UK, Euro STOXX 600 down 0.38%, 0.14%, 0.13% respectively.
The departure of Steve Banon and Carl Icahn.
Technical Analysis
Dow Jones Industrial Averages (INDU)

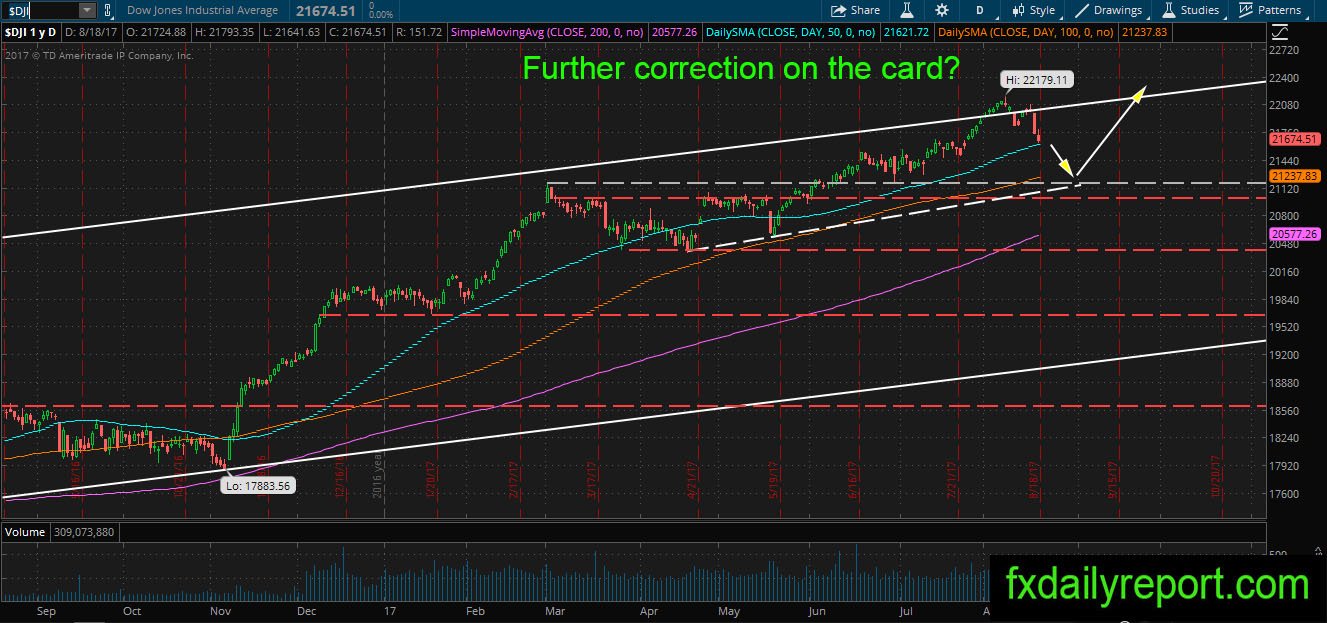
DJIA rejected from the white trendline and the index visit its daily SMA 50. It is possible for the index to bounce from the averages, but further correction might be on the card as index futures pointed downward. If the index continues lower, it might visit 21,000.
LyondellBasell Industries (LYB)
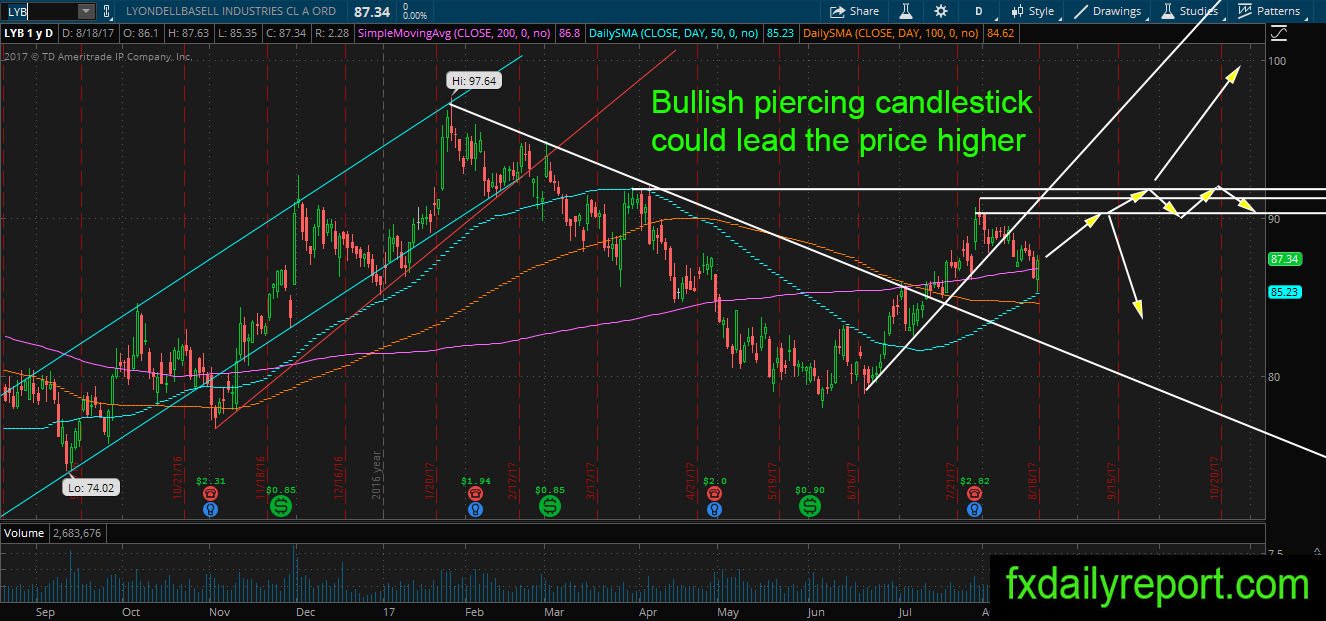
LYB has reclaimed position above daily SMA 200 and continue higher to test $90 – $91.50 area where it reversed. Currently, the price re-testing the averages and formed a bullish piercing pattern. If the bull could push the price higher, we might see another test of $90 – $91.50 area.
Guess? Inc (GES)
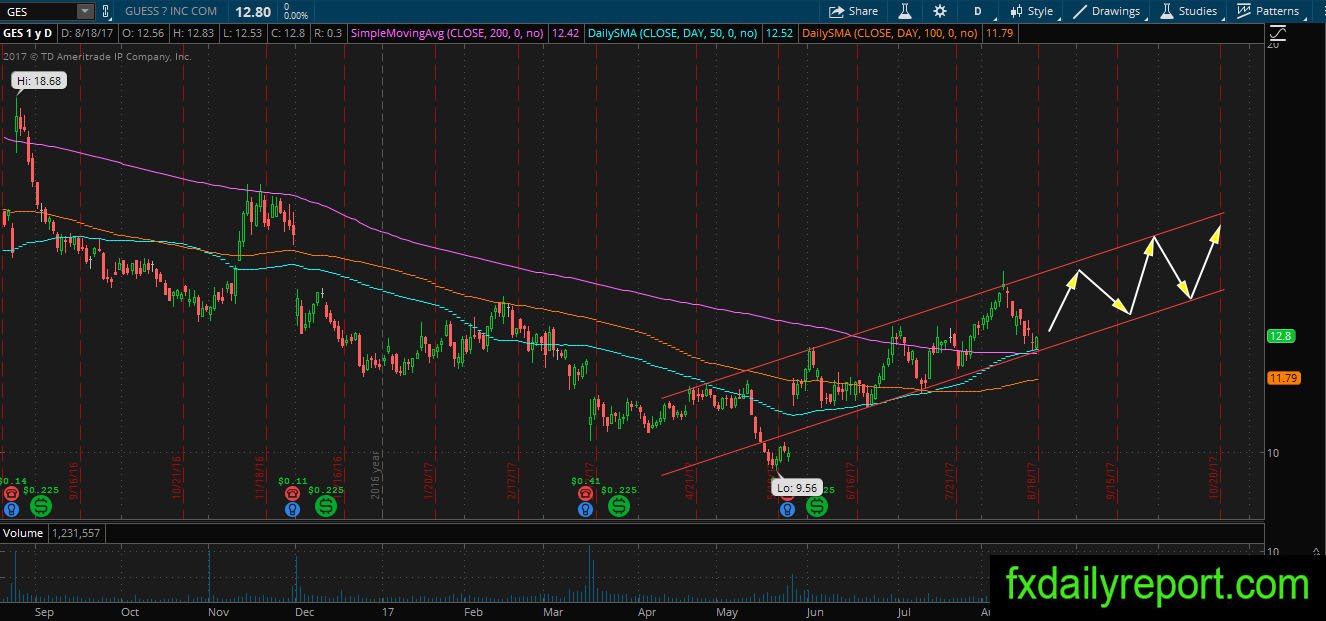
Similar to LYB but with clearer setup, GES tested the daily SMA 200 and showed initial bullish reaction. There is bullish harami pattern and if broken upside will lead GES share prices higher. Successful break upside will lead GES to reach the top of the red bullish channel.
Franklin Resources Inc (BEN)
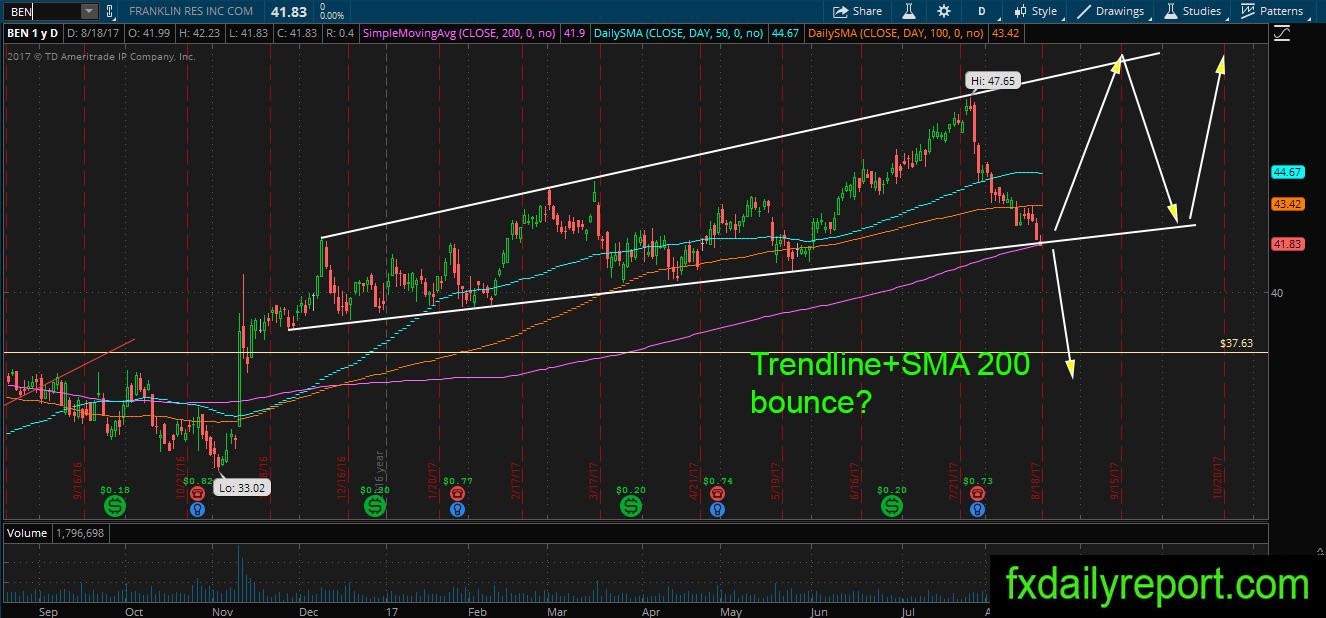
BEN continue moving lower to fulfill the trend line bounce. The price expected to bounce from the lower trend line where there is daily SMA 200 present. This is a high-odds pattern, and traders only need either a fakeout break below the trendline and close above it. Alternatively, a bullish pattern formation at the lower trend line.
Nevertheless, two days close below daily SMA 200 will cancel the bullish setup.
Other watch lists
NKE – The share prices gap down to the daily SMA 200. If it could hold the price above the averages, there is the possibility of a bounce.
HPQ – The price hit daily SMA 50 & 100, looking for support.
ITW -The downward movement in share prices continue, it will soon reach daily SMA 200 where traders could look for support and place long position.