
U.S stock market set to end August in a high note
The stock market gain in August has erased the losses incurred before the coronavirus drop. S&P 500 and Nasdaq continue to print impressive gains in the hope that economy will recover. DJIA also on the path higher and set to target the all-time high at 29,568.57.
Last week, the Fed announced an “Average inflation targeting” strategy to cope with coronavirus impact. It is a dovish stance and might cause interest-rate to stay near the current level for long period.
Asian & European Stock market

The Asian stock market mostly lower except Japan’s Nikkei. Japan stock market up 257. 11 points (+1.12%) to 23,139.76, China stock market down 8.13 points (-0.24%) to 3,395.68 and Australia ASX 200 down 13.30 points (-0.22%) to 6,060.50. The European stock market significantly higher. DAX Germany up 0.70%, FTSE UK down 0.61%, Euro STOXX 600 up 0.44%
Technical Analysis
Dow Jones Industrial Average (INDU)
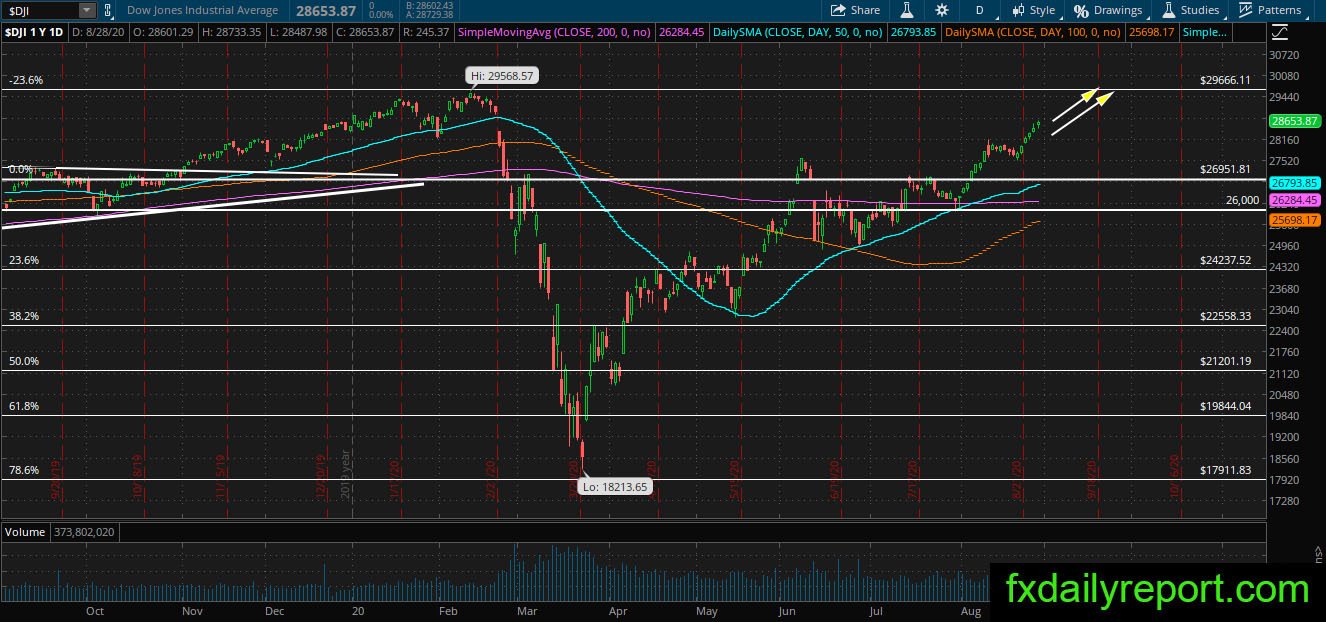
The bullish streak of the DJIA index continue, there was no bearish day last week and this week the index futures higher 71 points. Without a major change in the index direction, it is expected to target 29,000 and the all-time high. Traders will continue to hold long positions in equity and observe the index reaction near the high.
Applied Materials Inc (AMAT)
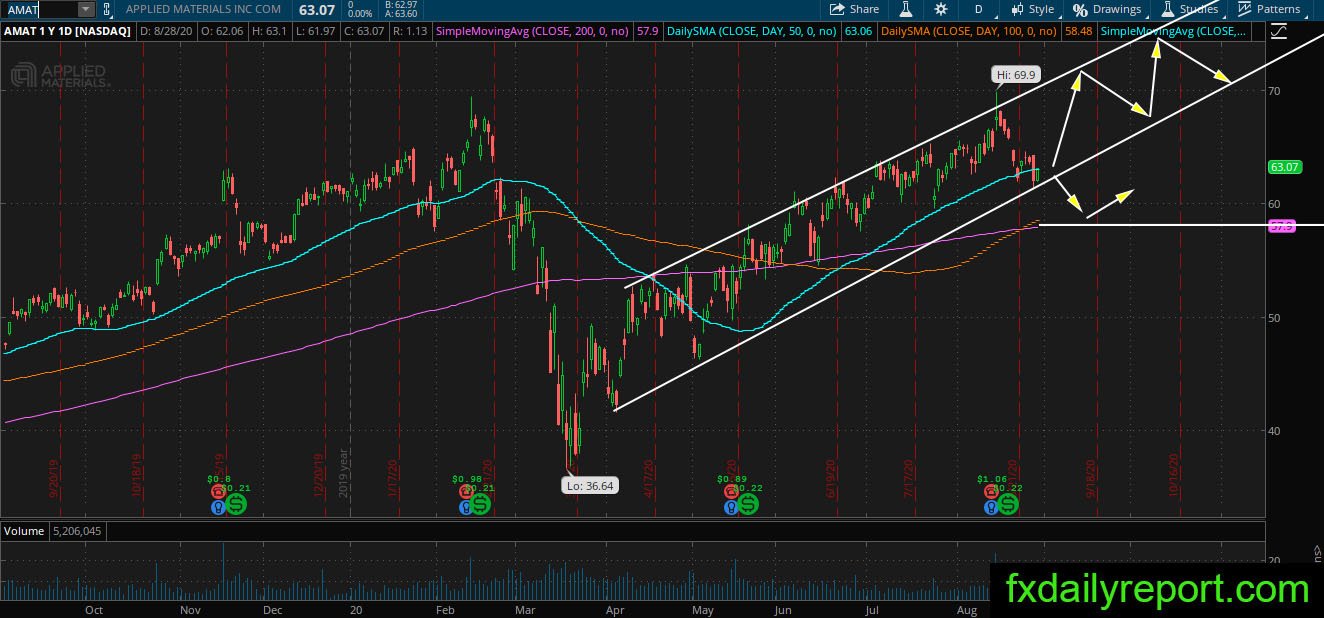
AMAT share prices moving inside a bullish channel and currently trading near the bottom of the channel. If the share prices could bounce from the bottom of the channel then it is expected to continue the bullish trend inside the channel. However, if a bearish breakout happens then AMAT might target the daily SMA 200.
Dollar Tree Inc (DLTR)

DLTR share prices make a bearish correction after reach the top trendline. The share prices currently trading near the daily SMA 50 and the trendline. If a bullish bounce happens then traders will expect DLTR to continue its bullish trend.
On the other hand, if DLTR moves lower then it will target the daily SMA 100 & 200 where traders could look for long positions.