
S&P 500 Rises as Traders Rotate into Defensive Sectors, but Index Heads for Losing Week
U.S. equity markets are posting solid gains during midday trading today. Specifically, the S&P 500 is moving higher because investors are actively rotating capital into defensive sectors. However, despite this intraday bounce, the broader index is still heading toward a losing week. Meanwhile, a broad-based recovery is lifting all three major indices out of early negative territory.
Currently, the Dow Jones Industrial Average (DJIA) is trading up by 175.52 points (+0.34%) at 52,096.14. Simultaneously, the S&P 500 has gained 24.24 points (+0.33%) to reach 7,381.73. Furthermore, the tech-heavy Nasdaq Composite is following suit, advancing 67.34 points (+0.27%) to stand at 25,425.943.
Dow Jones Industrial Average (INDU)

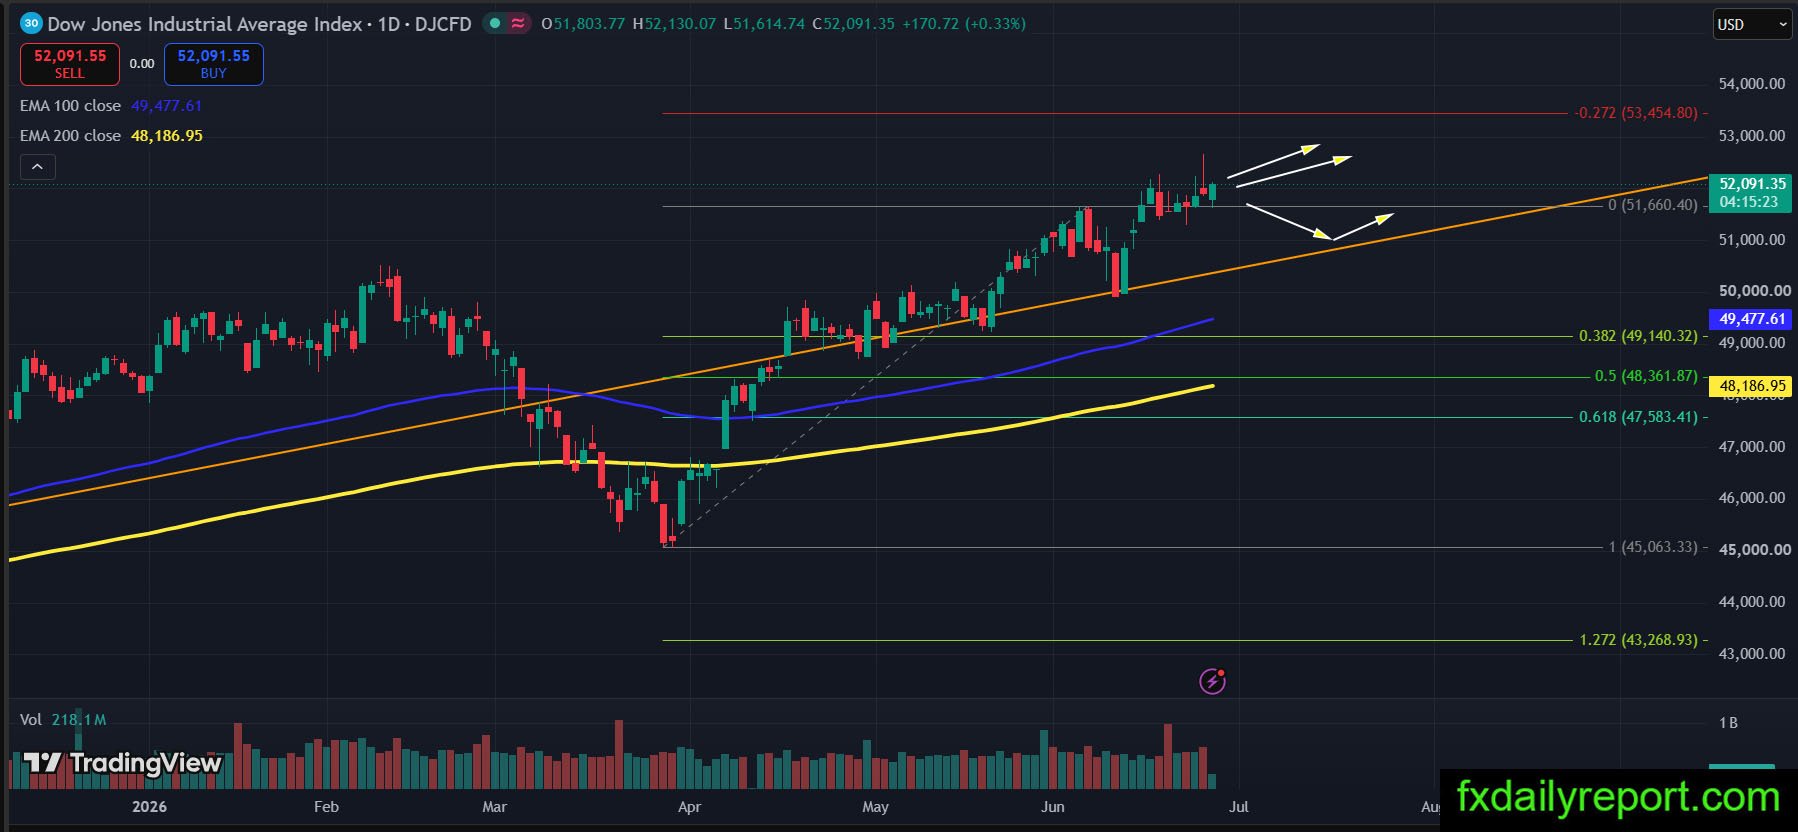
The DJIA was initially trading lower at the beginning of the day. However, the index reversed its course and is trading significantly higher now. Consequently, the price action is currently hanging near its recent high. Furthermore, buyers remain firmly in control since no strong bearish reaction has emerged yet. If the index eventually turns lower, then the ascending trendline will act as the crucial support level to watch. On the upside, momentum traders are looking for an extension. Therefore, the 127.2% Fibonacci Extension remains the primary target to watch for further gains.
Freeport-McMoRan, Inc. (FCX)
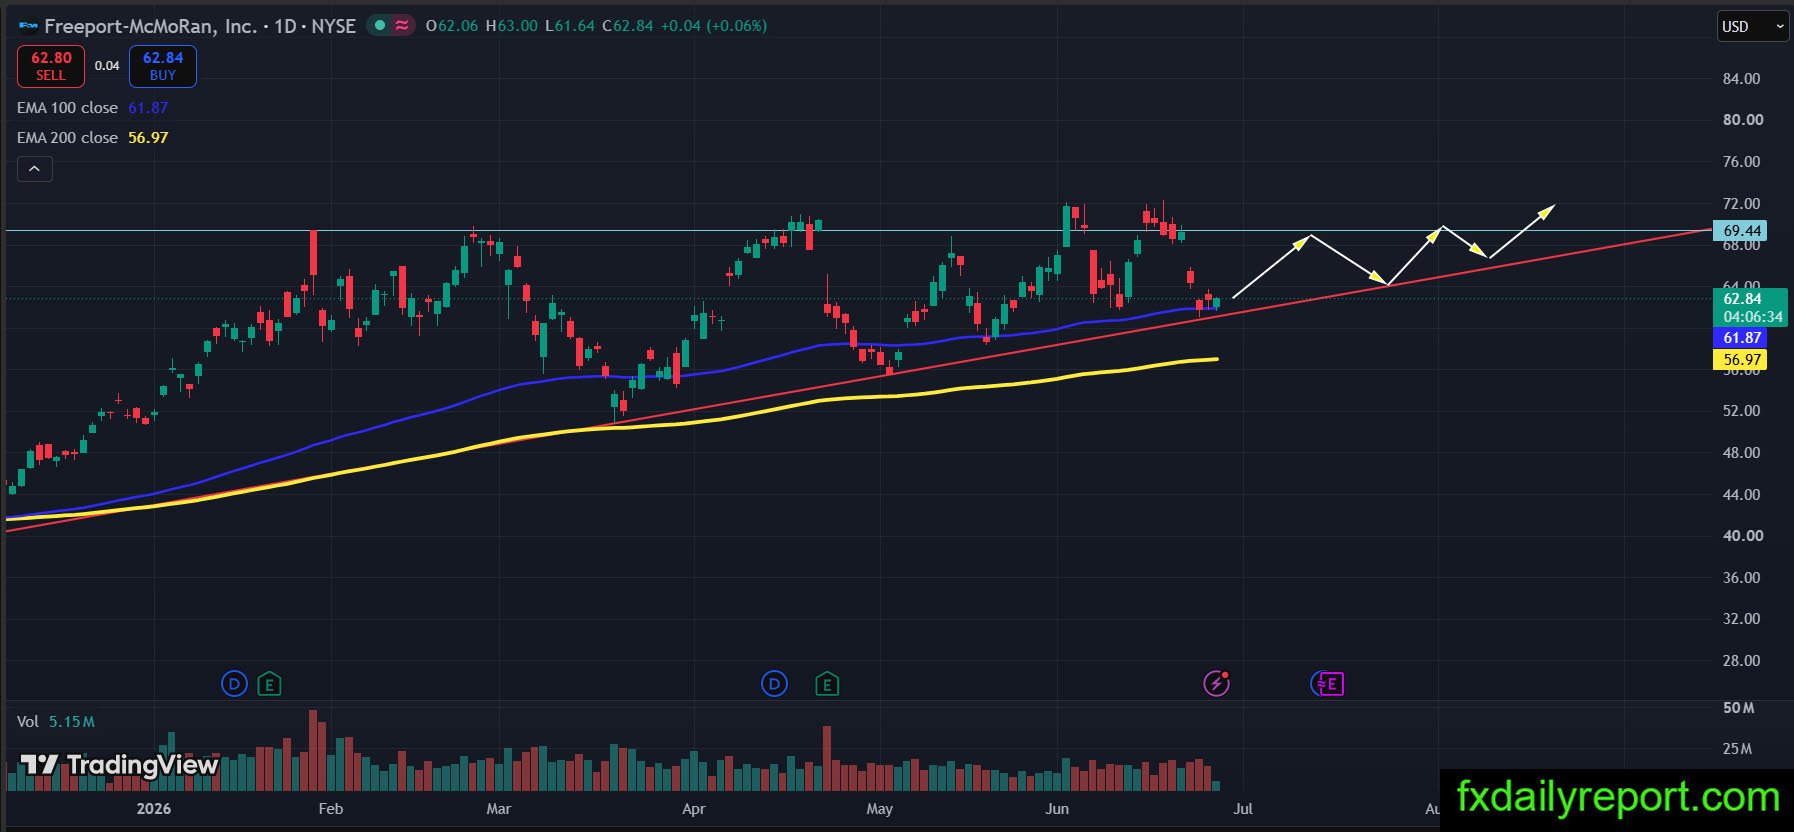
Meanwhile, Freeport-McMoRan, Inc. (FCX) continues moving steadily inside a well-defined triangle consolidation pattern. At the current time, the share prices are trading precisely at the bottom boundary of this consolidation. Consequently, this specific technical positioning offers a classic opportunity for traders to enter new long positions. Traders could continue to apply range trading strategies while patiently expecting an eventual breakout. If the support holds firmly, the price will likely rebound toward the upper resistance line. Conversely, a clear breakdown below this triangle pattern would completely negate the short-term bullish outlook.