
The USD/CAD currency pair on Wednesday pulled back from the trendline resistance before finding support at the 1.2033 level. The currency appears to be trading in a consolidative triangle formation within a descending channel.
The currency pair has now fallen to trade below the 100-hour moving average in the 60-min chart. The pair also appears to be moving closer to the oversold levels of the 14-hour RSI. This could trigger a temporary rebound.
USD/CAD Fundamentals Overview

From a fundamental perspective, the USD/CAD currency pair is trading at the back of a relatively busy period in the US market. On Tuesday, the US ISM Manufacturing PMI for May beat the expectation of 60.7 with 61.2. The ISM Manufacturing Prices Paid and New Order Index also outshone 86.8 and 66.3 with 88 and 67, respectively. On the other hand, the ISM Manufacturing Employment Index missed 61.5 with 50.9 while the Markit manufacturing PMI beat 61.5 with 62.1.
In Canada, the annualized (QoQ) gross domestic product for Q1 missed the expectation of 6.7% with 5.6%. On the other hand, GDP for March outperformed 1% with 1.1% (MoM) while the Markit Manufacturing PMI for May missed 57.9 with 57. Earlier in the week, Canada’s current account balance missed 3.4 billion with 1.18 billion.
Traders will be looking forward to Thursday’s ISM Services PMIs, the ADP Employment Change, and the initial jobless claims ahead of the Jobs data on Friday.
USD/CAD Technical Analysis (the 60-min Chart)
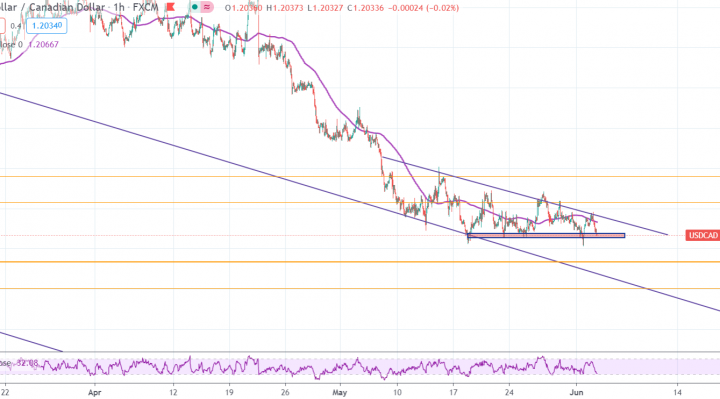
Technically, the USD/CAD currency pair appears to be trading within a consolidative triangle formation in the 60-min chart. The pair remains largely within a descending channel formation. This indicates a short-term bearish bias in the market sentiment.
The bulls will be targeting short-term rebound profits at around 1.2114 or higher at 1.2180. On the other hand, the bears will look to extend the current bearish run towards 1.1967 or lower to 1.1901.
USD/CAD Technical Analysis (the Daily Chart)
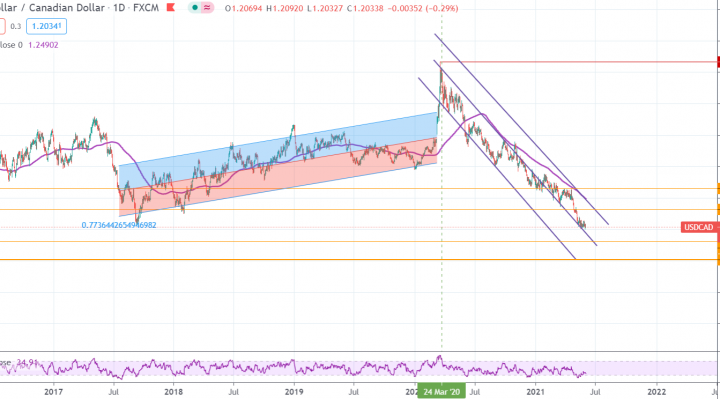
In the daily chart, the USD/CAD currency pair appears to be trading within a sharply descending channel formation. The pair recently bounced back to recover from oversold levels of the 14-day RSI.
The bulls will be targeting long-term profits at around 1.2321 or higher at 1.2651. On the other hand, the bears will look to extend the current declines towards 1.1810 or lower to 1.1514.