
The USD/CAD currency pair on Tuesday found support around the 1.2090 level after Monday’s pullback. The currency pair continues to trade within a descending channel formation in the 60-min chart. It remains several levels below the 100-hour and the 200-hour SMA lines.
The pair recently bounced back to recover from the oversold levels of the 14-hour RSI. The current pattern formation could continue through Friday. This gives an advantage to the bears.
USD/CAD Fundamentals Overview

From a fundamental perspective, the USD/CAD currency pair is trading at the back of a relatively busy period in the US market. Last week, the US released numbers for last month’s non-farm payrolls, the ADP employment change, and the ISM PMIs. All missed expectations. On Tuesday, the NIFB business optimism index for April improved from 98.2 to 99.8. On the other hand, the US JOLTs job openings for April outshone the expectation of 7.5 million with a count of 8.123 million.
The US Redbook Index for May posted a (YoY) change of 13.3% compared to the previous posting of 14.2%. Traders will be looking forward to Wednesday’s US CPI ex-food and energy. The general CPI data will also be out. Both figures are expected to improve on a (YoY) basis compared to March.
USD/CAD Technical Analysis (the 60-min Chart)

Technically, the USD/CAD currency pair appears to be trading within a descending channel formation in the 60-min chart. This indicates a significant short-term bearish bias in the market sentiment. The currency pair recently bounced back to recover from oversold levels of the 14-hour RSI.
The bulls will be targeting short-term rebound profits at around 1.2150 or higher at 1.2205. On the other hand, the bears will look to pounce on potential declines at around 1.2050 or lower at 1.2005.
USD/CAD Technical Analysis (the Daily Chart)
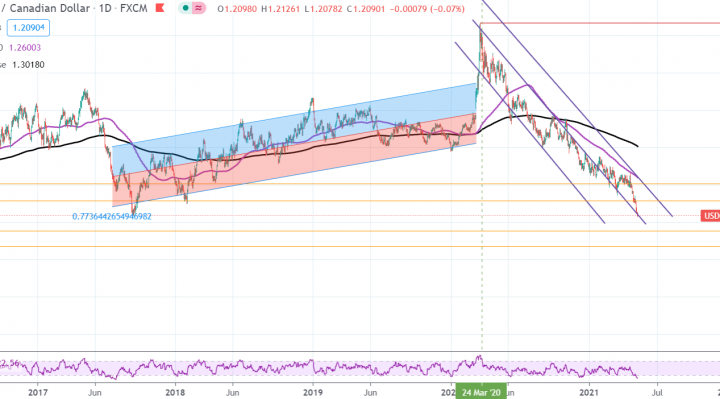
In the daily chart, the USD/CAD currency pair appears to have plunged to new multi-year lows. The pair continues to trade within a sharply descending channel formation. It has now crossed to the oversold levels of the 14-day RSI. This could trigger a rebound.
The bulls will be targeting long-term rebound profits at around 1.2290 or higher at 1.2510. On the other hand, the bears will target extended declines at around 1.883 or lower at 1.1676.