
The USD/JPY currency pair on Friday pulled back off the current multi-year highs of about 140.811 to trade at about 140.140 following the latest round of US data. The currency pair continues to trade within an ascending channel formation in the 60-min chart.
The pair has now rallied to trade several levels above the 100-hour moving average line. Friday’s late pullback pushed the currency pair off overbought conditions back to the normal trading zone of the 14-hour RSI.
USD/JPY Fundamentals Overview

From a fundamental perspective, the USD/JPY currency pair is trading at the back of a relatively busy period in the US market. On Friday, the US Department of Labour Statistics reported a net job creation of 315k for August, beating the consensus estimate of 300k.
On the other hand, the economy registered an unemployment rate of 3.7%, the highest level since February, falling short of the consensus forecast of 3.5%. Elsewhere, the average hourly wage growth for the month missed the market forecast of 5.3% (YoY) with a change of 5.2%, while factory orders for July missed the (MoM) estimate of 0.2% after posting a change of -1%.
In Japan, the Jibun BankManufacturing PMI for August outperformed the expectation of 51 with 51.5. Earlier in the week, the preliminary industrial production for July beat both the (MoM) and (YoY) expectations of -0.5% and -2.6%, respectively with 1% and -1.8%. On the other hand, the seasonally adjusted retail trade for July outperformed -0.5% with a change of 0.8% (MoM), while the (YoY) equivalent beat 1.9% with a change of 2.4%.
USD/JPY Technical Analysis (the 60-min Chart)
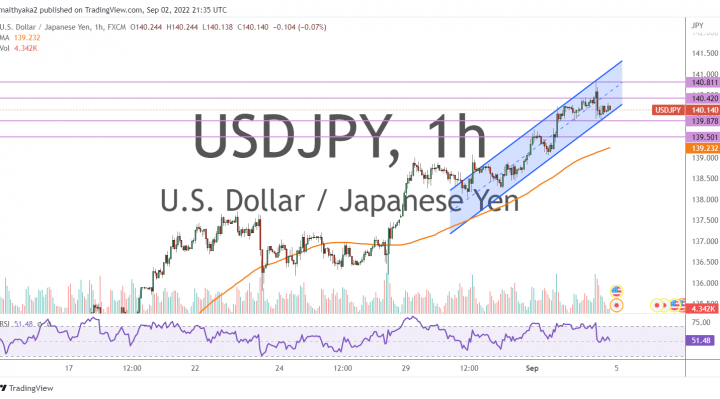
Technically, the USD/JPY currency pair seems to be trading within an ascending channel formation in the 60-min chart. This indicates a significant short-term bullish bias in the market sentiment.
Therefore, the bulls will be looking to ride the current rally towards 140.420 or higher to 140.811. On the other hand, the bears will be targeting potential pullbacks at about 139.878 or lower at 139.501.
USD/JPY Technical Analysis (the Daily Chart)
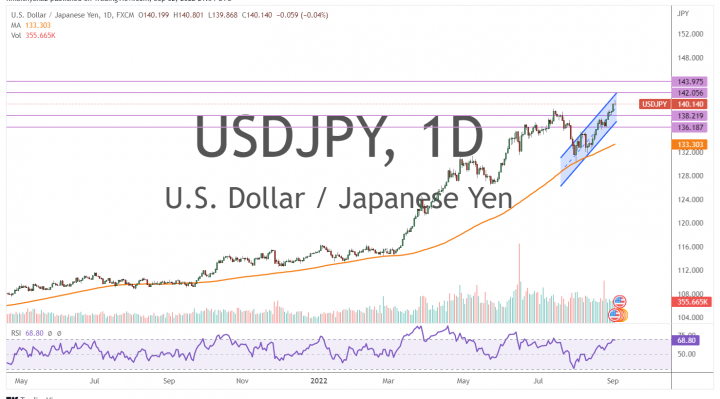
In the daily chart, the USD/JPY currency pair seems to be trading within a sharply ascending channel formation. This indicates a strong long-term bullish bias in the market sentiment.
Therefore, the bulls will be targeting long-term profits at about 142.056 or higher at 143.975. On the other hand, the bears will look to pounce on profits at about 138.219 or lower at 136.187.