
On Friday, the USD/JPY currency pair pulled back from the session highs of about 159.86 to trade at about 158.89. The currency pair trades within a sideways channel formation on the 60-minute chart.
The pair has now fallen to trade a few levels below the 100-hour moving average line. As a result, the currency pair plummeted into the oversold levels of the 14-hour RSI.
USD/JPY Fundamentals Overview

From a fundamental perspective, the USD/JPY currency pair trades during a relatively busy period in both markets. In Japan, the National Consumer Price Index for October rose to 2.3% (YoY), up from 2.1% in September. On the other hand, the National CPI ex-food and energy fell to 2.2%, down from 2.4% (YoY).
The National CPI ex-fresh food rose to 2.2%, up from 2.1%, below the forecast (YoY) change of 2.3%. Japanese exports for October beat the forecast (YoY) change of 20%, with a change of 20.5%. Imports for the period fell short of 25.8%, with a (YoY) change of 21.6%.
In the US, the initial jobless claims for last week increased to 203k, up from the previous week’s equivalent of 202k, and above the forecast claim count of 197k. On the other hand, the Philadelphia Fed Manufacturing Survey for November fell to 6.3, down from 20.9, missing the forecast reading of 20.
Earlier in the week, US building permits for October fell to 1.295 million, down from 1.398 million, missing the forecast of 1.38 million. On the other hand, housing starts for the period rose to 1.309 million, up from 1.221 million, ahead of the forecast of 1.27 million.
USD/JPY Technical Analysis (the 60-min Chart)
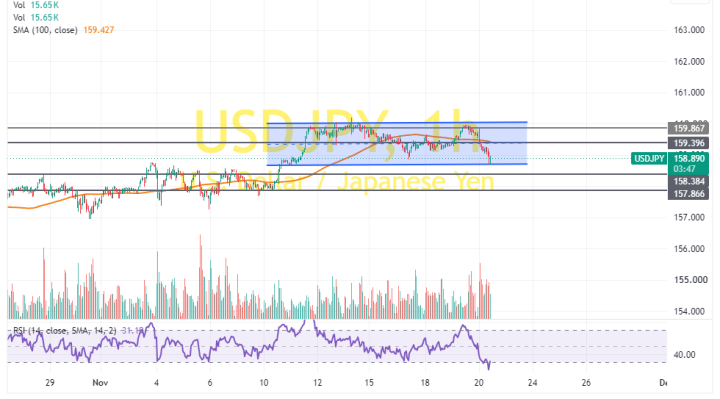
Technically, the USD/JPY currency pair trades within a sideways channel formation on the 60-minute chart. However, the 14-hour RSI has recently pulled back into oversold conditions.
Therefore, the bears will look to stretch the current pullback towards 158.38 or lower, down to 157.86. On the other hand, the bulls will look to pounce on rebounds at about 159.39 or higher, up to 159.86.
USD/JPY Technical Analysis (the Daily Chart)
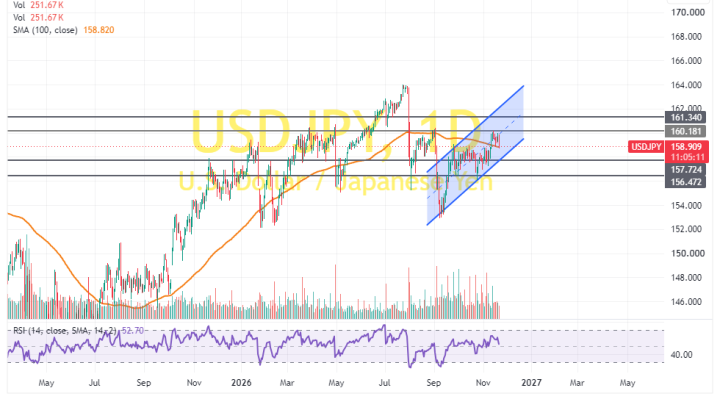
In the daily chart, the USD/JPY currency pair trades within an ascending channel formation. However, the 14-day RSI has recently pulled back to avoid rallying into overbought conditions.
Therefore, the bears will look to extend the latest pullback towards 157.72 or lower, down to 156.47. On the other hand, the bulls will look to pounce on profits at about 160.81 or higher, up to 161.34.