
WMT Long-term outlook
Walmart (NYSE: WMT) business outlook continues strong and outperforming its counterpart in the same business. As a result, the share prices currently traded at an all-time high and look to add further gain. However, the report said the company racking losses of more than $1 billion on its e-commerce business. Although the e-commerce operation just accounts for 5% of the company business, in the future it is the direction the company headed too.
WMT future will depend on how it transforms in current disruptive era.
New Month
Monthly chart


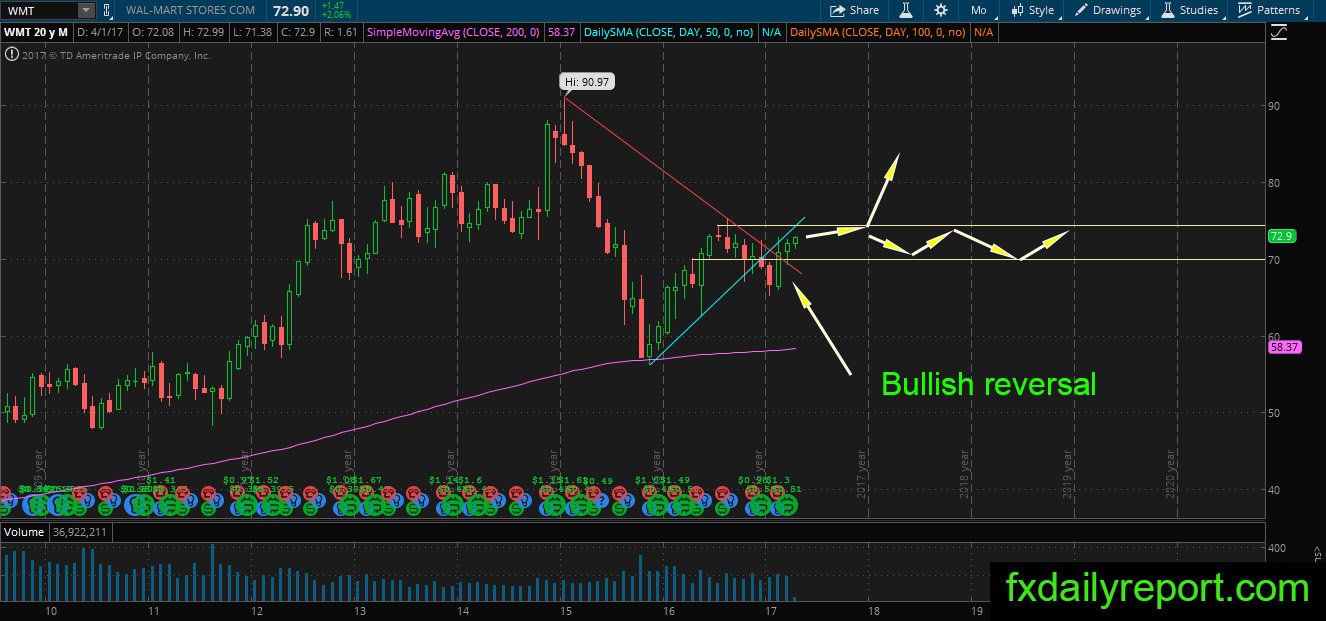
WMT share prices moving in an extremely bullish manner, breaking above all-time high. There is no stop to the bullish pressure yet and traders might want to continue holding long positions. If the bullish movement continues then $120.00 – $122.24 and $130.04 will become the upside target.
Weekly chart

WMT has a triangle pattern on the weekly chart which was broken upside. The share prices never look back and continue upward to print new all-time high. At the current time, $110.00 is the nearest support level. Traders might want to enter a long position when bearish correction happen. The top of trendline could be considered as a level to take long positions.
Daily chart

The outlook of the WMT daily chart is similar to the outlook on the weekly chart. At the current time, the share prices just bounce from the $110.00 support level. We have a bullish pin bar pattern which indicates a continuation. Let the share prices move further upside until it loses momentum and starts a bearish correction before placing any positions.
Trade plan
No long-term positions traders could take for the moment. Short-term long positions are possible when pullback happens. $110.00 is the nearest level to watch.