
The price of oil on Thursday plunged to trade at a new weekly low of about $63.00 before bouncing back to settle just below the $64.00 level. The WTI Crude oil continues to trade in a highly volatile ascending trend formation in the 60-min chart.
Thursday’s late rebound pushed the light crude oil to trade just below the 200-hour SMA. The 100-hour SMA is pinned a few levels higher. The oil price has since recovered from the oversold levels of the 14-hour RSI to trade within the normal trading zone.
WTI Crude Oil Fundamentals Overview

From a fundamental perspective, oil is trading at the back of a relatively busy period in the US market. The upside potential continues to be hampered by the new variants of the covid-19 amid a slowdown in vaccine rollouts. This week has also been a mixed bag in terms of economic data with little positivity to drive oil prices higher. Earlier in the week, Australian retail sales missed expectations. China’s April CPI also came shortly while Germany’s harmonized index of consumer prices was in line with expectations. The UK GDP and the US CPIs beat expectations.
In the latest rig count data, the API weekly crude oil stocks for the period ending May 7 came in at -2.533 million compared to -7.688 million barrels reported in the preceding period. On the other hand, the EIA crude oil stocks change report for the same period missed the expectation of -2.817 million with a change of -0.427 million. This compares to a change of -7.99 million reported in the previous period.
WTI Crude Oil Technical Analysis (the 60-min Chart)
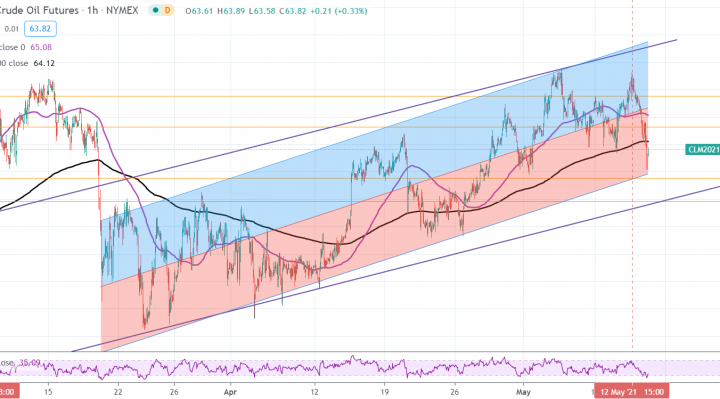
Technically, the price of WTI Crude oil appears to be trading within a highly volatile ascending channel formation in the 60-min chart. This indicates a significant short-term bullish bias in the market sentiment.
The bulls will be looking to extend this run by targeting profits at around $64.64 or higher at $65.77. On the other hand, the bears will target potential pullbacks at around $62.77 or lower at $61.91.
WTI Crude Oil Technical Analysis (the Daily Chart)
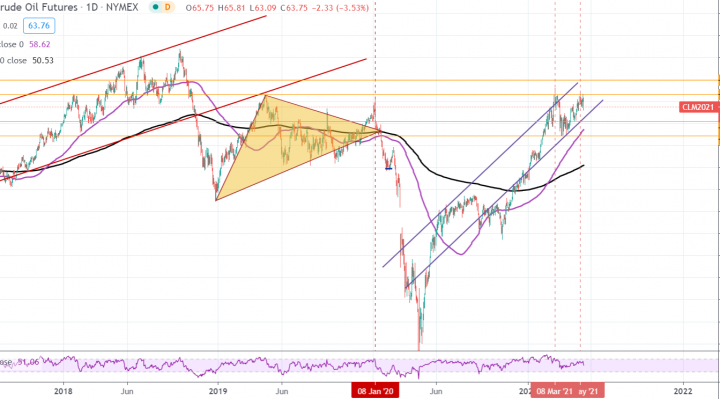
In the daily chart, the light crude oil appears to be trading within a sharply ascending channel formation. This indicates a strong long-term bullish bias in the market sentiment. The oil price has surged closer to the overbought levels of the 14-day RSI.
The bulls will be looking to ride the current rally towards $66.59 or higher at $69.80. On the other hand, the bears will be looking to pounce on pullbacks at around $60.52 or lower at $57.22.