
WTI crude oil appears to be carving out a head and shoulders reversal pattern on the short-term time frame, with the left shoulder and head formed during the sharp rally into late July, and price now attempting to complete the right shoulder near the $85.50 neckline area.
If this second shoulder holds as resistance, a break below the neckline could confirm the pattern and set the stage for a larger downside move.

The commodity has already pulled back sharply from its highs, slicing through the 100 SMA and 200 SMA in the process, which is a sign that the path of least resistance could be shifting to the downside. Both moving averages are converging near current price, and a decisive close below them could reinforce the bearish bias suggested by the chart pattern.
The Fibonacci extension tool highlights several downside targets that align with the potential head and shoulders projection. The 38.2% level sits at $79.47, close to where price is currently consolidating, while the 50% extension is at $77.61.
A deeper move could reach the 61.8% level at $75.75, and a full-blown reversal could extend all the way to the 76.4% extension at $73.44 or even the 100% target at $69.72, which lines up with a longer-term support zone.
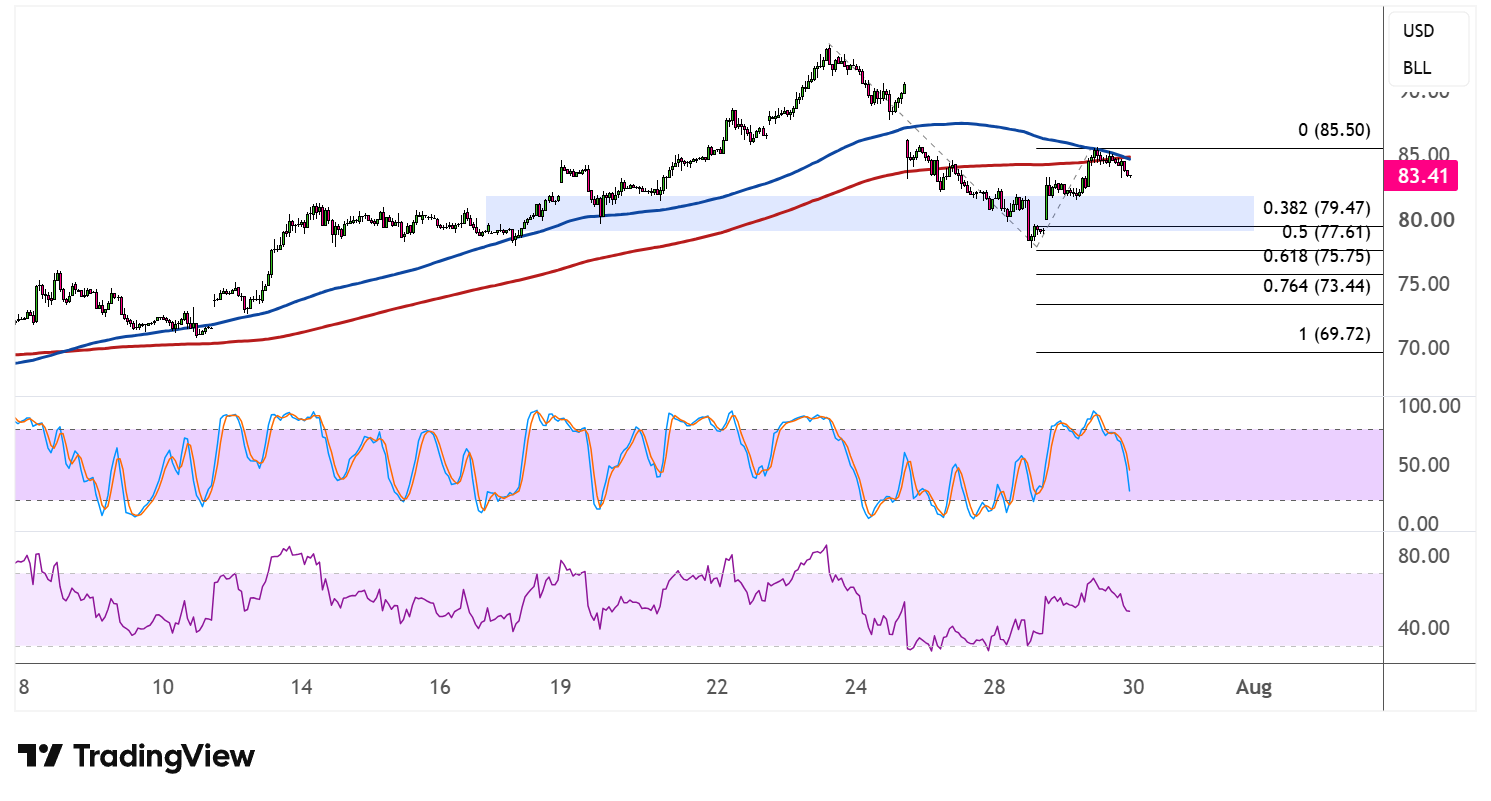
Stochastic has room to climb before reaching overbought territory, suggesting that a bit more upside consolidation could unfold before sellers step back in to challenge the neckline. RSI, on the other hand, is hovering in the mid-range, reflecting indecision as the market digests the recent selloff and awaits confirmation of the pattern.
Should crude oil fail to reclaim the neckline and moving averages, a break lower could validate the head and shoulders setup and trigger a slide toward the Fibonacci extension targets. Conversely, a strong rebound back above the neckline and moving averages would invalidate the bearish pattern and open the door for another leg higher toward the recent swing high.