
WTI crude oil has been carving out a symmetrical triangle pattern on the short-term time frame, with price recently attempting a bullish breakout above the formation’s upper boundary.
The commodity is currently trading around $99.00, and if buyers can sustain the push above the triangle top, the measured move from the pattern could signal considerably more upside ahead.

The symmetrical triangle formed as price printed a series of lower highs and higher lows, compressing into a tightening range before the recent breakout attempt. A clean close above the descending upper trendline would confirm that bulls have wrested control from the consolidation, potentially setting the stage for a rally toward the $105.00 area and beyond, depending on the height of the formation.
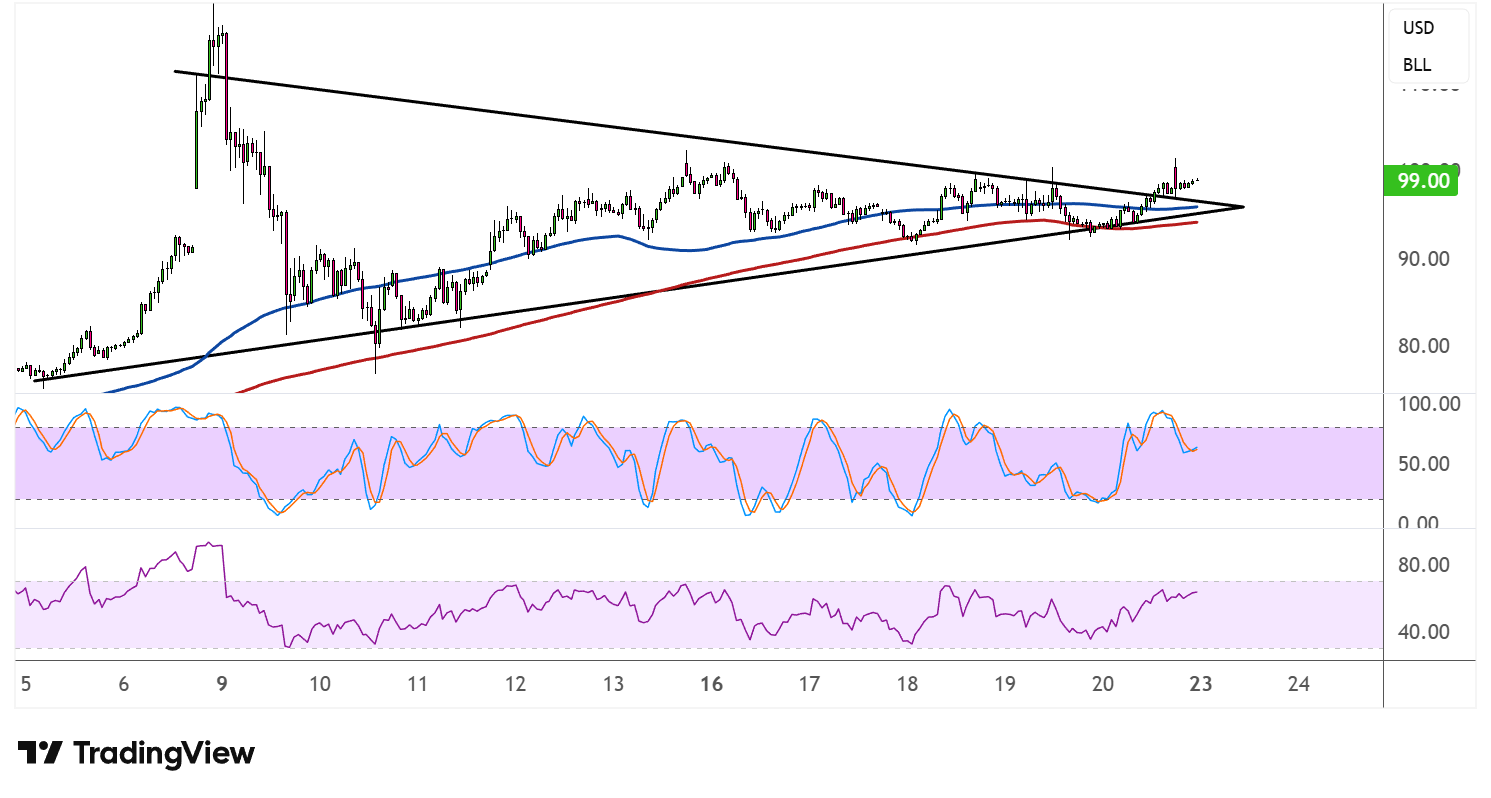
On the moving averages front, the 100 SMA (blue) is above the 200 SMA (red), confirming that the path of least resistance remains to the upside and that the broader bullish trend is still intact. Price has also climbed back above both indicators following a brief dip below them mid-pattern, suggesting the moving averages could now flip to dynamic support on any pullbacks.
Stochastic has just pulled back from the overbought region after the most recent surge, with the lines beginning to cross lower. This hints at a potential short-term consolidation or mild pullback before the next leg higher. If the oscillator can dip and then turn back up without reaching oversold levels, it would signal that bullish momentum remains robust.
RSI is holding comfortably within the upper half of its range and appears to be turning higher again, reflecting sustained buying interest. As long as the oscillator holds above the midpoint, dips in price are more likely to attract fresh buyers, keeping the breakout scenario firmly in play and the broader uptrend on track.
Geopolitical headlines related to Trump’s deadline on Iran could determine where energy markets are headed next.