
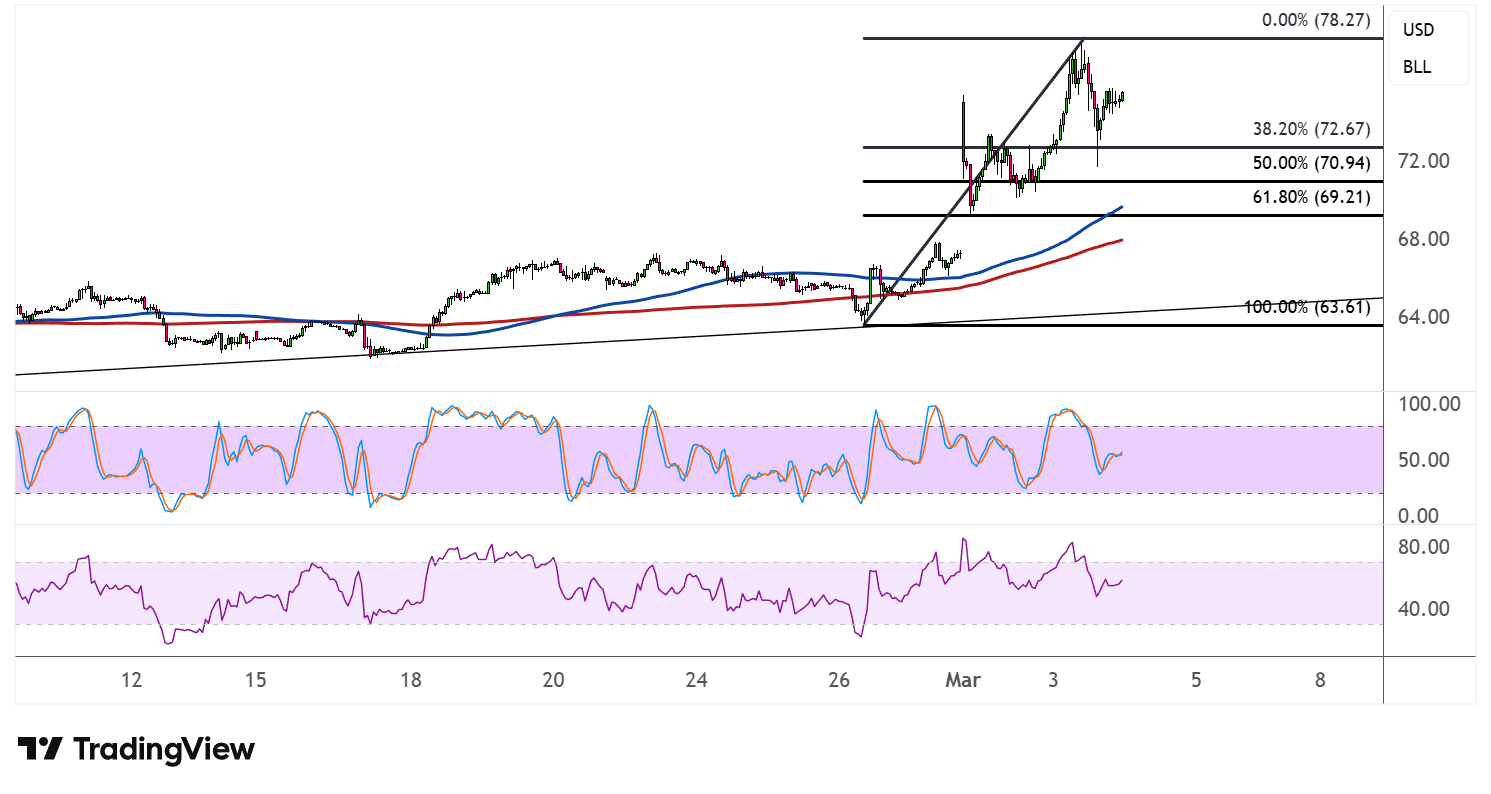
WTI crude oil staged an impressive rally after bouncing off the ascending channel support near $63.61, surging sharply higher to tag the swing high around $78.27 before pulling back.
Price now appears to be consolidating below this peak, with the Fibonacci retracement tool highlighting the key levels where buyers could be waiting to re-enter.

The 38.2% Fib sits at $72.67, which could provide an initial floor for the pullback. A deeper correction could bring price down to the 50% level at $70.94, while a more significant retracement could stretch toward the 61.8% Fib at $69.21 or a level that also lines up with a potential area of interest and possible dynamic support from the moving averages.
On the subject of moving averages, the 100 SMA has crossed above the 200 SMA to confirm that the path of least resistance is to the upside, and that the climb is more likely to gain traction than to reverse. Price is currently trading above both indicators, which are curling upward and could act as dynamic support on any dips, reinforcing the bullish structure.
Stochastic is retreating from the overbought zone, suggesting that sellers are starting to apply some pressure in the near term. The oscillator has room to slide before reaching oversold territory, which means the pullback could extend further before buyers regain control. A turn higher from one of the Fib levels, however, would signal that bullish momentum is ready to resume.
RSI is also pulling back after recently pushing into overbought territory, and likewise has room to decline before hitting the oversold region. If the oscillator stabilizes and turns upward near one of the Fibonacci levels, it could align with a fresh leg higher, potentially sending WTI back toward the $78.27 swing high or beyond.
WTI crude oil could continue to take cues from geopolitical developments, as the prolonged closure of the Strait of Hormuz could keep shipping and supply concerns in play.