
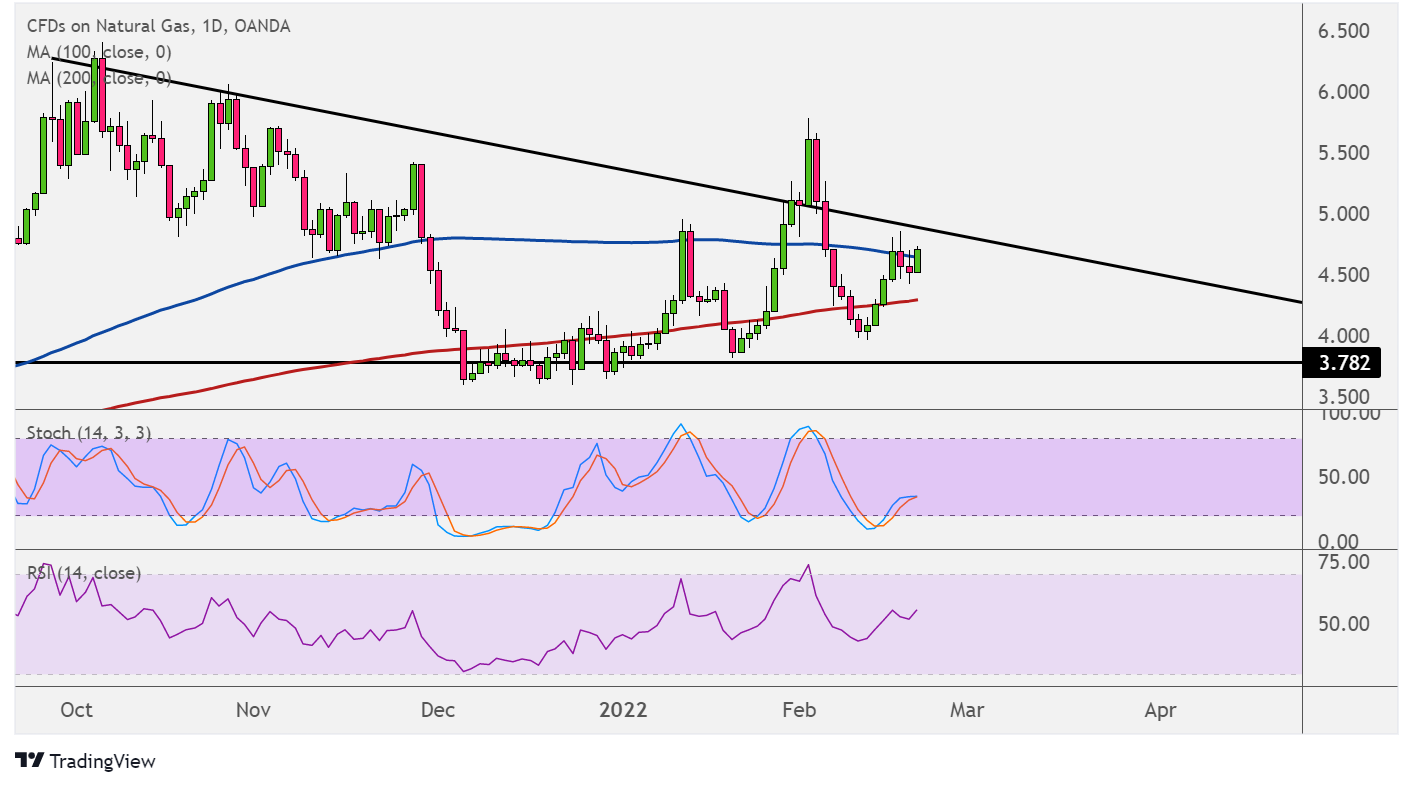
Natural gas formed lower highs and found support at the $3.780 area, creating a descending triangle on its daily time frame. Price is gearing up for another test of the resistance and might attempt a break higher.
The commodity price has formed higher lows recently, suggesting a buildup in bullish pressure. The 100 SMA is above the 200 SMA to indicate that the path of least resistance is to the upside or that resistance is more likely to break than to hold. Price seems to be finding support at the dynamic inflection points at the moving averages, too.

Then again, the gap between the moving averages is narrowing to reflect weakening bullish momentum and a potential bearish crossover. If this materializes, natural gas could slide back to the triangle bottom.
Stochastic is pulling higher from the oversold region to signal a return in bullish pressure while sellers take a break. A bullish divergence can also be seen, as the oscillator made lower lows while price had higher lows.
Similarly RSI is on the move up to confirm a pickup in bullish pressure. A break above the triangle top around $4.500 could set off a climb that’s the same height as the triangle pattern.
Natural gas appears to be on weaker footing recently, as temperatures have been rising in some parts of the US, leading to lower purchases of heating commodities.
The latest inventory report from the Department of Energy also reflected a smaller reduction in stockpiles, indicating that demand is slowing or that supply is keeping up. The earlier figure came in at a draw of 190 Bcf versus the expected reduction of 203 Bcf and the earlier drop of 222 Bcf.
The upcoming inventory figure could determine whether or not the trend in natural gas purchases is starting to slide and that the seasonal rally for the heating commodity has reached its peak.