
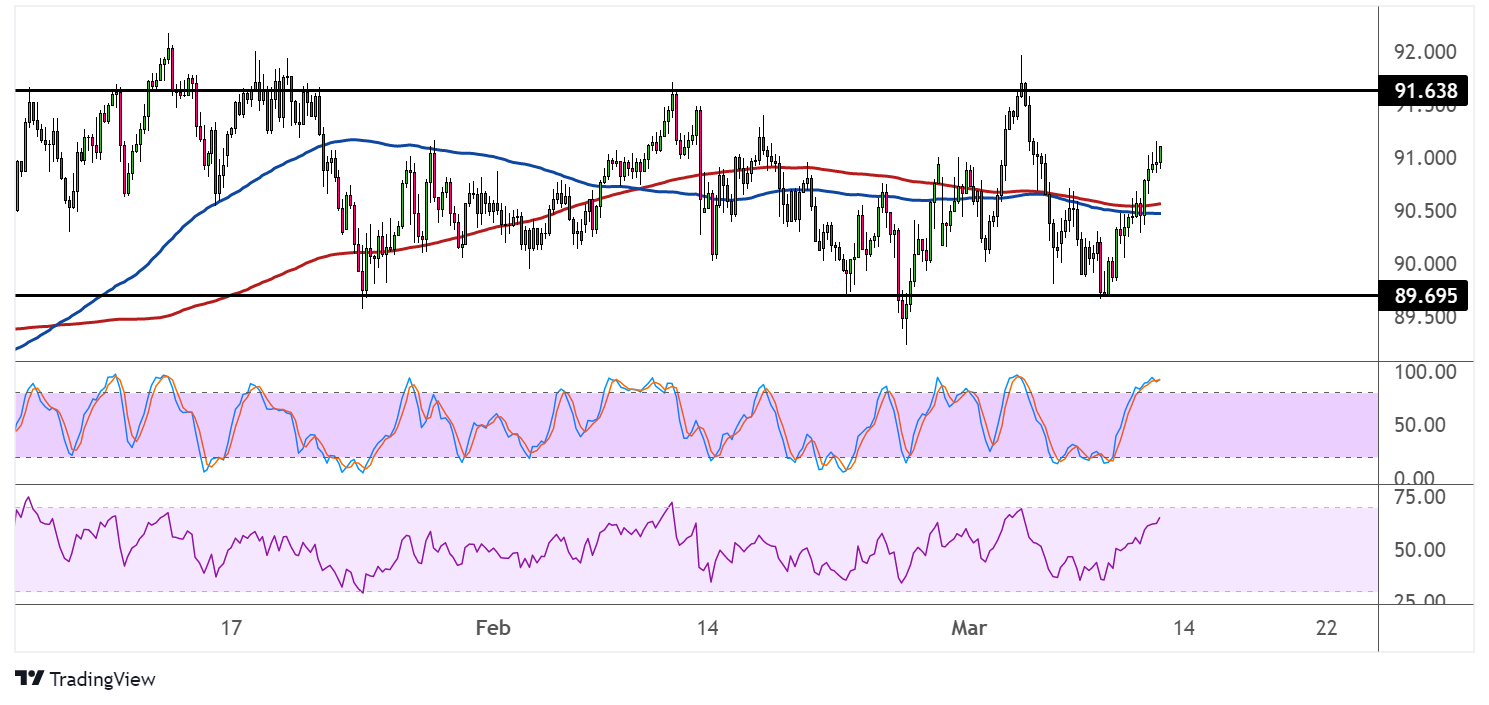
CADJPY is trading sideways on its 4-hour time frame, moving between support at the 89.70 area and resistance around 91.65. Price is on its way to test the top of the range once more.
The 100 SMA is below the 200 SMA to indicate that the path of least resistance is to the downside or that resistance is more likely to hold than to break. In that case, CADJPY could fall back to the range support or at least until the middle around 90.75-91.00.

Stochastic already reached the overbought territory to reflect exhaustion among buyers, so turning lower would confirm that sellers are taking over. RSI has a bit more room to climb before reaching the overbought area, so buyers could stay in control for a while longer.
CADJPY could take cues from the upcoming release of Canada’s jobs report. Analysts are expecting a rebound of 132K in hiring after the earlier drop of 200.1K, and this should be enough to bring the jobless rate down from 6.5% to 6.2%.
A weaker than expected result, however, could mean more downside for the Loonie since this might dash hopes of another BOC hike. Keep in mind that protests in Canada might have led to job losses in the past month. Stronger than expected data, on the other hand, could mean more gains for the Canadian currency.
A break past the resistance could set off a rally that’s the same height as the rectangle pattern or around 200 pips. Similarly a move below support could be followed by a selloff of the same size.
Also note that risk-taking might also push this pair around, along with movements in the oil market. Risk-off flows might favor the lower-yielding yen, but the Loonie is also drawing some support from surging oil prices.