
The gold price on Friday extended gains to a new 11-month high of about $1,968 following the latest round of US data. The price of the yellow metal appears to have spiked to complete an upward breakout from an ascending channel formation.
Gold is now trading several levels above the 100-hour moving average line. As a result, the yellow metal has now advanced to trade deep into the overbought levels of the 14-hour RSI.
Gold Price Fundamentals Overview

From a fundamental perspective, the gold price appears to be benefitting from the latest round of US data. On Friday, the preliminary Michigan Consumer Sentiment Index for March missed the expected reading of 67 with a reading of 63.4. The preliminary UoM 5-year consumer expectations for March posted a change of 2.8% compared to 2.9% in the previous update.
On Thursday, the initial jobless claims for last week outperformed the expected claim count of 205k with a lower tally of 192k. On the other hand, the Philadelphia Fed Manufacturing Survey for March missed the forecasted reading of -14.5 with a reading of -23.2.
Elsewhere, housing starts for February outperformed the expected count of 1.31 million with a tally of 1.45 million, while building starts for the period beat 1.34 million with 1.524 million. Earlier in the week, retail sales missed the expected change of -0.3% with a change of -0.4%, while the retail sales control group beat -1.2% with a change of 0.5%.
Gold Price Technical Analysis (the 60-min Chart)
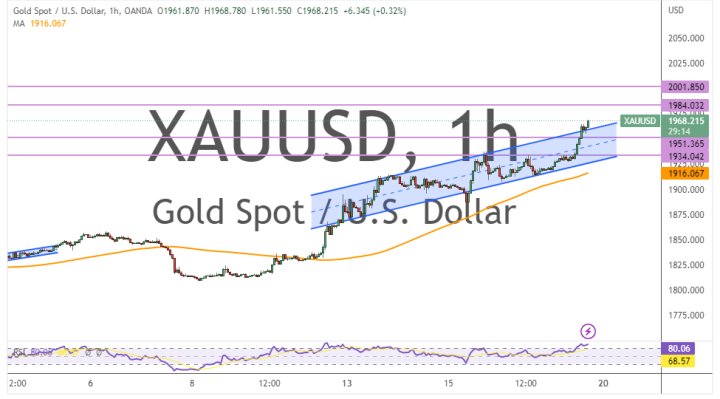
Technically, the price of the yellow metal appears to have recently completed an upward breakout from an ascending channel formation. This indicates a significant increase in the bullish market sentiment.
Therefore, the bulls will be looking to extend the current run of gains toward $1,984 or higher to $2,001. On the other hand, the bears will be targeting potential pullbacks at about $1,951 or lower at $1,934.
Gold Price Technical Analysis (the Daily Chart)
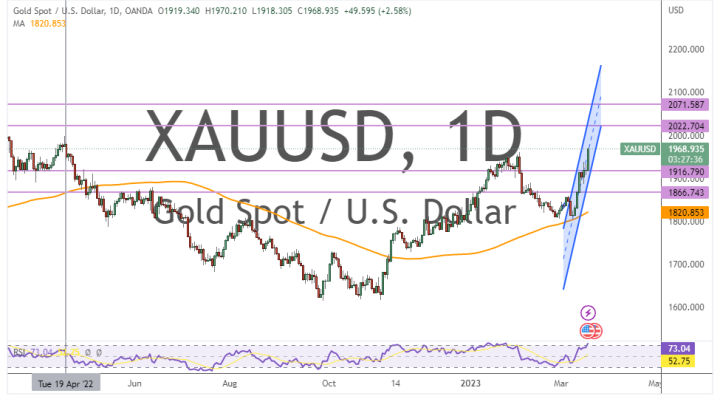
In the daily chart, the XAU/USD appears to be trading within a sharply ascending channel formation. This indicates a strong long-term bullish bias in the market sentiment.
Therefore, the bulls will be looking to ride the current rally towards $2,022 or higher to $2,071. On the other hand, the bears will be targeting long-term profits at about $1,916 or lower at $1,866.