
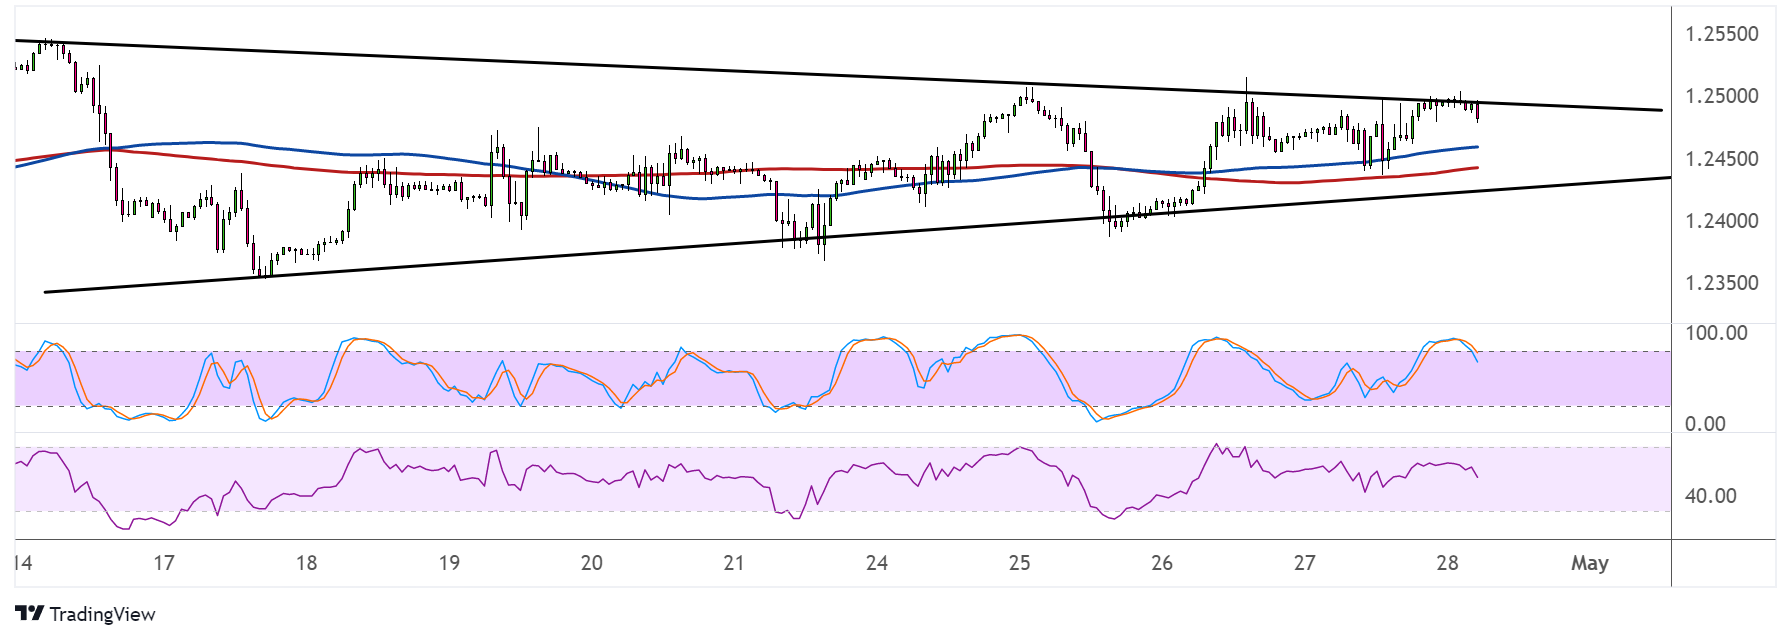
GBPUSD has formed lower highs and higher lows to consolidate inside a symmetrical triangle pattern on its hourly time frame. Price is testing resistance and might be due for a dip back to support soon.
If sellers continue to defend the 1.2500 major psychological mark, the pair could drop to the bottom at the 1.2450 minor psychological level. Technical indicators are looking mixed on whether or not resistance might hold.

The 100 SMA is still above the 200 SMA to suggest that the path of least resistance is to the upside or that resistance is more likely to break than to hold. If that happens, GBPUSD might be in for a rally that’s the same height as the chart formation or around 100 pips.
However, stochastic is already turning lower from the overbought region to signal that bears are taking over while bulls are taking a break. The oscillator has plenty of room to drop before reaching the oversold region to reflect exhaustion among sellers.
RSI is also turning lower without even reaching the overbought area, suggesting that sellers are eager to take over. Sustained bearish momentum might even spur a break below support and a selloff that’s the same height as the chart pattern.
Risk sentiment has been flipping back and forth throughout the week, as the US dollar has grappled with downbeat economic data and safe-haven flows stemming from banking sector concerns.
The US economy also printed lower than expected Q1 GDP data, further dashing hopes of more tightening from the Fed past the middle of the year. Later today, the core PCE price index is due and another weak result could mean a pickup in dovish central bank expectations.
Meanwhile there have been no major reports out of the UK economy, as traders are still holding out hope for more BOE hikes due to stubbornly strong inflation.