
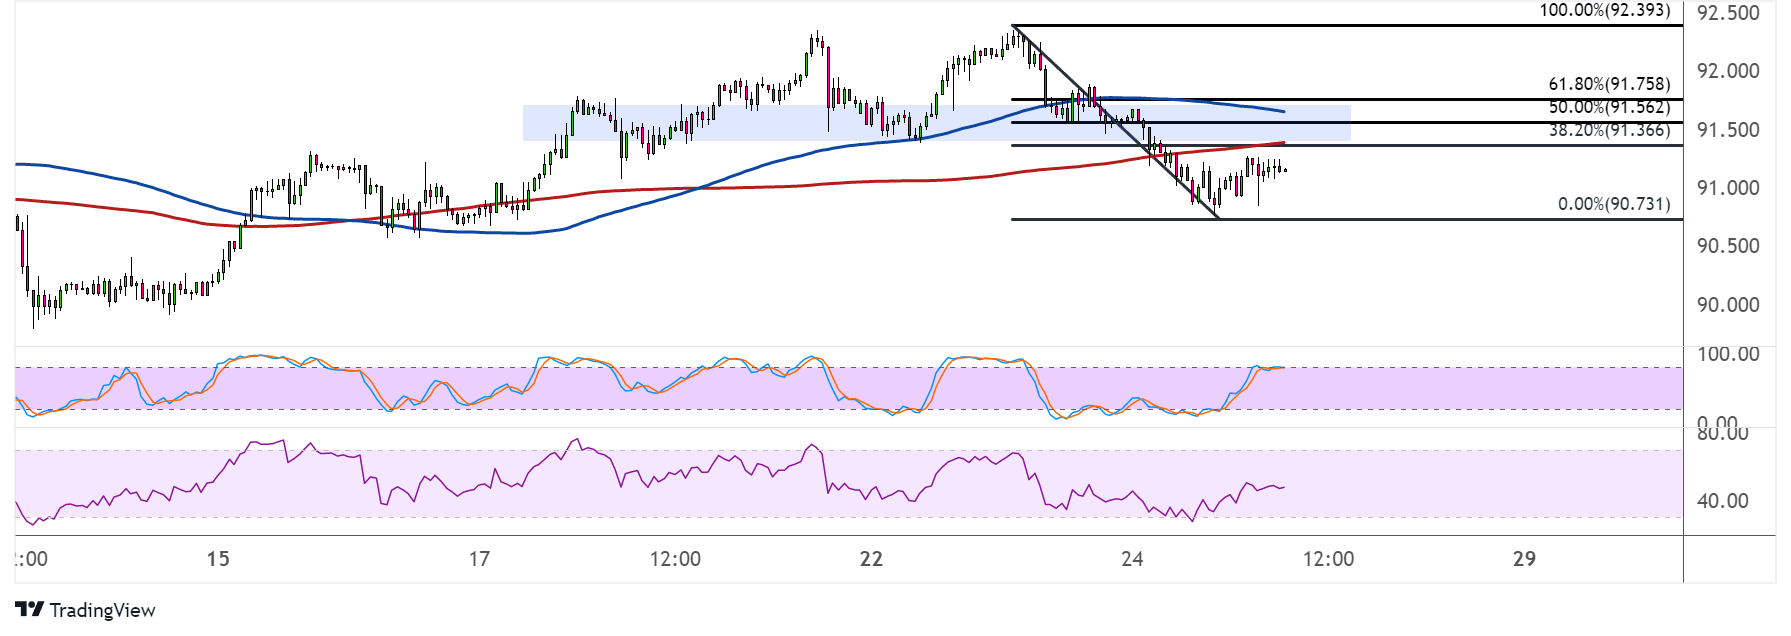
AUDJPY recently fell through the neckline of its double top pattern on the hourly chart, signaling that a selloff of the same size is due. Price seems to be in the middle of a pullback to the former support zone.
The Fibonacci retracement tool shows that this area of interest is spanned by the 50% to 61.8% levels around 91.50 to 92.00. If the ceiling holds, AUDJPY could resume the slide to the swing low at 90.73 or lower.

The 100 SMA is above the 200 SMA for now to reflect upside momentum, but the gap between the moving averages has narrowed enough to signal a potential bearish crossover. Also, AUDJPY is trading below both indicators, so these could hold as dynamic resistance levels.
Stochastic has a bit more room to climb but seems to be topping out near the overbought zone. Turning lower would confirm that sellers are ready to take over.
However RSI has more ground to cover before reflecting overbought conditions or exhaustion among buyers, so the correction could keep going for now.
The Aussie could be under weak footing as traders continue to price in another pause from the RBA in their next meeting. Most central banks are already shifting to a less hawkish bias now that global inflationary pressures are starting to slow down.
Meanwhile, the yen could also draw support now that the BOJ might be closer to ending its easing policy. The latest round of inflation figures from Japan showed some green shoots while policymakers have also been noting these improvements.
Risk-off flows could also favor the safe-haven yen, especially if the US debt ceiling talks end at a standstill by this week. The June 1 deadline is drawing closer, but negotiations seem to have moved backwards recently, likely keeping uncertainty in play.