
The Bitcoin Price on Friday pulled back off the session highs of about $62,098 to trade at about $60,321 after US data. The BTC/USD trades within a descending channel formation in the 60-minute chart.
The pioneer cryptocurrency has now fallen to trade below the 100-hour moving average line. As a result, Bitcoin appears to be on the verge of entering the oversold levels of the 14-hour RSI.
Bitcoin Price Fundamentals Overview

From a fundamental perspective, the BTC/USD is trading at the back of a relatively busy period in the US market. On Friday, the UoM 5-year inflation expectations for June missed the expectation of 3.1% with 3%, down from 3.1% in the preceding period.
The Chicago Purchasing Managers’ Survey for June outshone the forecast of 40 with 47.4, while the Michigan Consumer Sentiment Index beat 65.8 with a reading of 68.2. Elsewhere, personal income outshone the expected (MoM) change of 0.4% with a change of 0.5%, while personal spending for the period missed 0.3% with a change of 0.2% (MoM).
Elsewhere, the US personal consumption expenditures – price index matched the expected (MoM) and (YoY) expectations of 0% and 2.6% respectively. The core personal consumption expenditures – price index for the period was also in line with the estimates of 0.1% (MoM) and 2.6% (YoY). Earlier in the week, the US initial jobless claims for the week ending June 21 outperformed the expectation of 235k with a claim count of 233k.
Bitcoin Price Technical Analysis (the 60-min Chart)
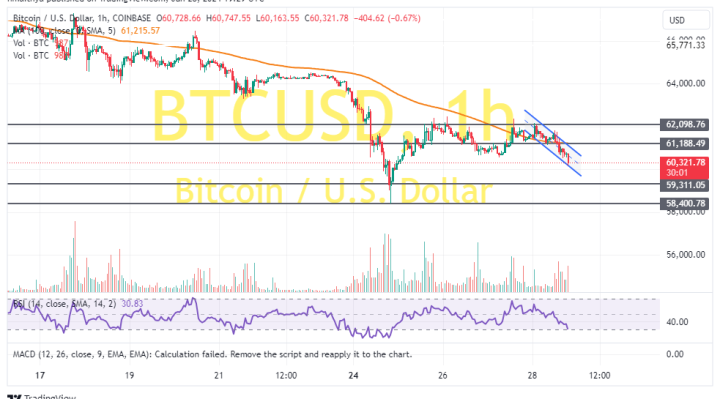
Technically, the BTC/USD trades within a descending channel formation in the 600-minute chart. The 14-hour RSI also seems to support a short-term bearish bias as it edges closer to oversold conditions.
Therefore, the bears will be targeting extended declines at about $59,311 or lower at $58,400. On the other hand, the bulls will look to pounce on rebounds at about $61,188 or higher at $62,098.
Bitcoin Price Technical Analysis (the Daily Chart)
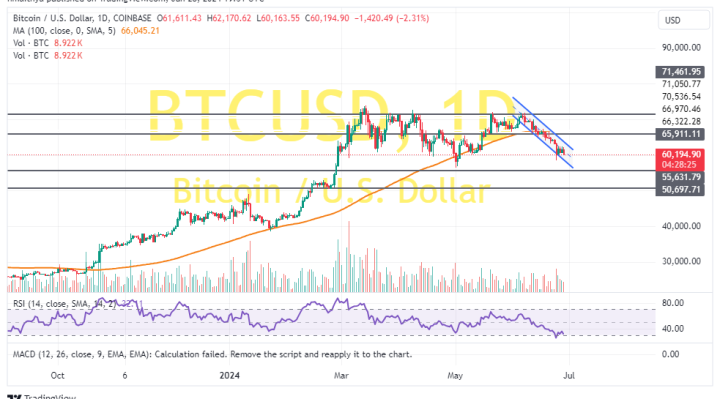
In the daily chart, the price of the pioneer cryptocurrency appears to be trading within a descending channel formation. The 14-day RSI also seems to support a long-term bearish bias as it moves closer to oversold conditions.
Therefore, the bears will be targeting extended declines at about $55,631 or lower at $50,697. On the other hand, the bulls will look to pounce on rebounds at about $65,911 or higher at $71,461.