
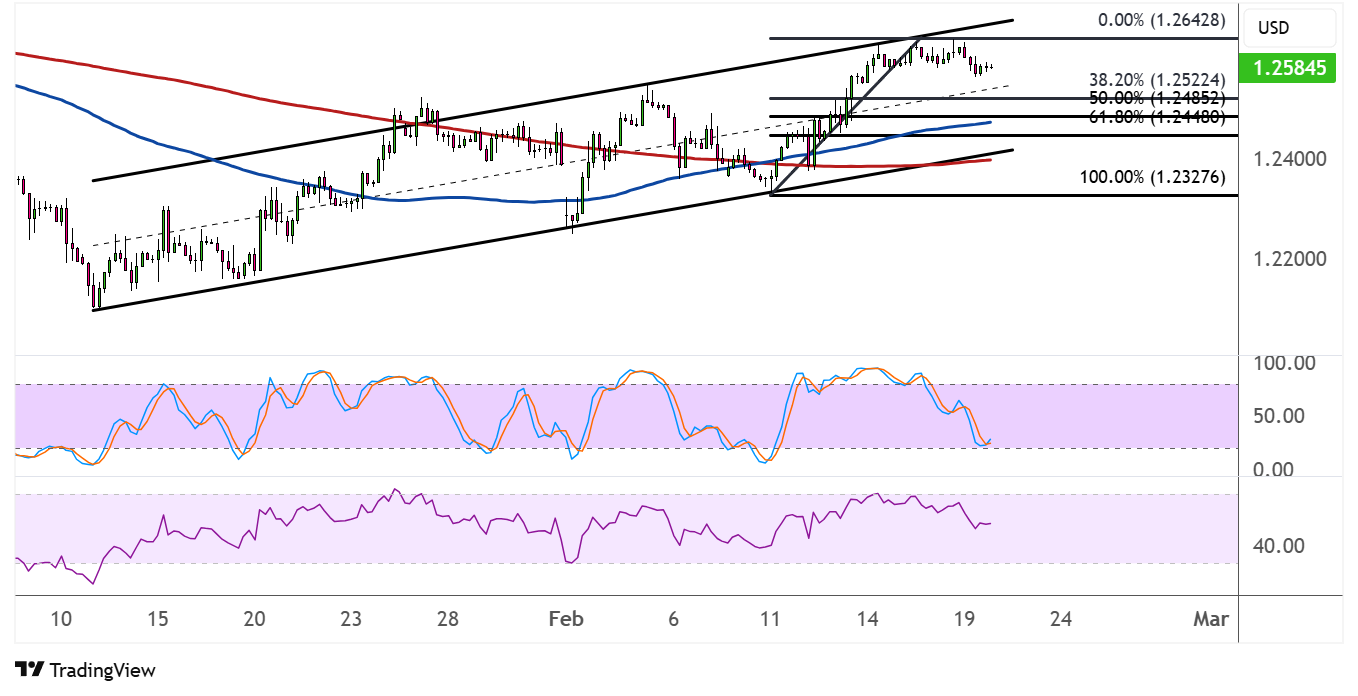
GBPUSD has formed higher lows and higher highs on its hourly time frame, with an ascending channel holding since mid-January. Price is testing the resistance and could be due for a correction.
The Fibonacci retracement tool shows where more buyers could be waiting to join the uptrend. The 38.2% Fib lines up with the mid-channel area of interest at 1.2522, then the 50% Fib is close to the 100 SMA dynamic support at 1.2485. The 61.8% level is closest to the channel support at 1.2448 and the 1.2450 minor psychological level.

The 100 SMA is above the 200 SMA to indicate that the path of least resistance is to the upside or that support is more likely to hold than to break. The 200 SMA could also serve as the line in the sand for a bullish correction, as a break below this could mean a reversal from the climb.
Stochastic is heading lower to reflect bearish pressure, but the oscillator looks ready to bottom out and move back up. There’s plenty of room to climb before overbought conditions are met, so price could follow suit and test the swing high at 1.2642 or channel top if buyers return.
RSI is also on the move down and has a bit of room to drop before reaching the oversold region, so the correction could keep going until that happens.
GBPUSD appears to be propped up by the dovish FOMC meeting minutes, as the transcript of their discussions revealed that the central bank is inclined to keep easing if needed. Meanwhile, sterling saw a pop higher on better than expected UK CPI data, as this could dampen odds of a BOE interest rate cut in their next meeting.
Recall that the BOE had a dovish split in their earlier decision to cut by 0.25%, as some policymakers called for an even larger 0.50% rate cut.