
EURUSD has formed higher lows connected by a rising trend line that’s been holding since February, and it looks like the pair is in for a correction to this support zone again.
Price is stalling at the highs at 1.0940 and the Fibonacci retracement tool shows levels where buyers might be hoping to catch the climb. The 38.2% Fib is at 1.0718, then the 50% level is at the 1.0650 minor psychological mark. The 61.8% level lines up with the trend line and an area of interest or former resistance zone that might hold as support near the 1.0600 major psychological level.

This also coincides with the dynamic support around the moving averages. The 100 SMA is above the 200 SMA to indicate that the path of least resistance is to the upside or that the climb is more likely to gain traction than to reverse. The gap between the indicators is widening to reflect strengthening bullish momentum as well.
Stochastic is pointing down to show that sellers are regaining the upper hand, with the oscillator still having plenty of ground to cover before reaching the oversold region to indicate exhaustion. This suggests that the correction could keep going until that happens and the oscillator turns higher from the oversold area.
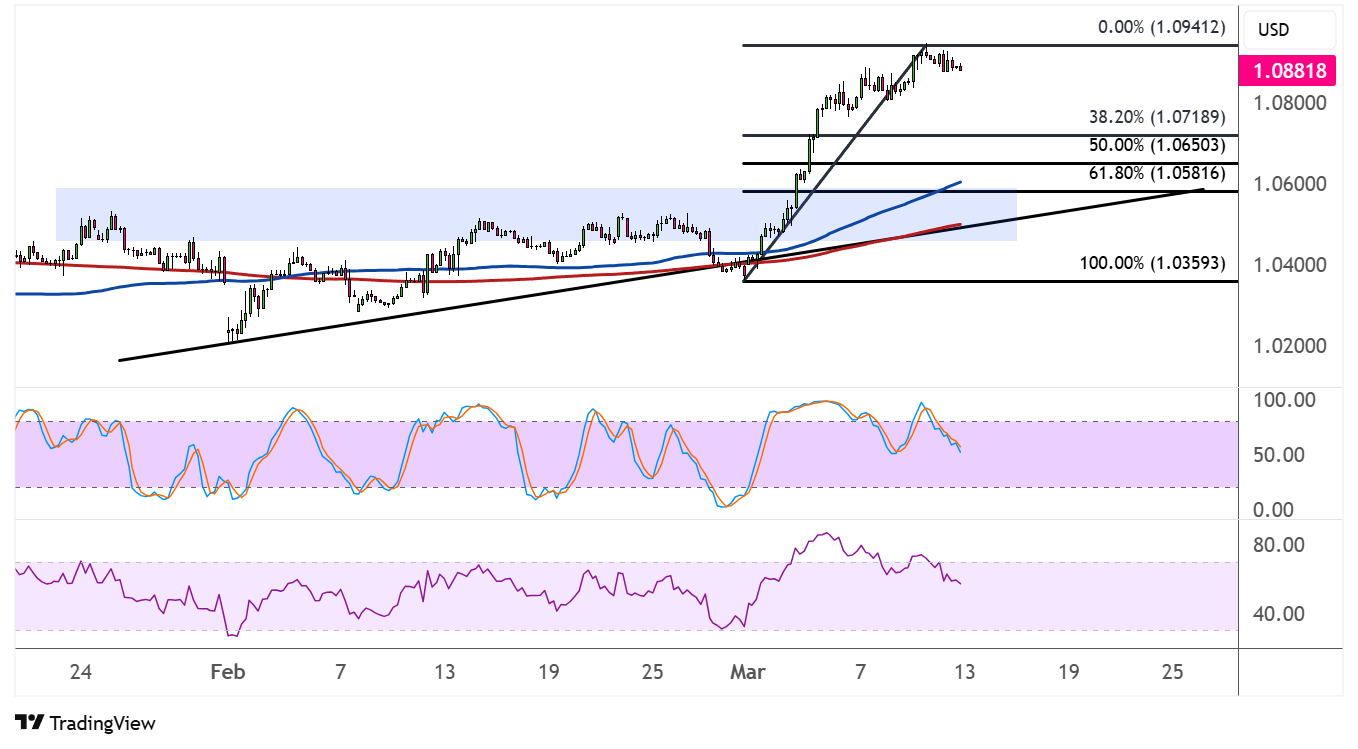
RSI has even more room to slide before reaching the oversold region, so price could keep following suit while bearish pressure is in play.
EURUSD could take cues from the US PPI release, as traders are still keeping close tabs on inflation data to gauge potential changes in the Fed’s policy bias. Another batch of weaker than expected results could bring more downside for the US dollar on expectations that the Fed could maintain a dovish stance while strong results could revive hopes for a more hawkish central bank.
Note that US tariffs on EU steel and aluminum are already in effect and that the latter has promised countermeasures on $18 billion worth of US products.