
EURNZD is currently trading at 1.91872, showing signs of recovery after a significant downtrend from the 100% Fibonacci level at 1.97606. The price action displays a potential bottoming pattern as the pair attempts to retest the broken support region.
Note that this area of interest is the neckline of a head and shoulders reversal formation, which suggests strong odds of bears returning at the correction levels to sustain the slide.

Price is closing in on the 38.20% Fibonacci retracement at 1.93225, which represents the first significant hurdle for the bulls. Moving higher, the 50.00% Fibonacci level at 1.94062 marks an important mid-point resistance that previously acted as a support area before the breakdown.
The 61.80% Fibonacci retracement at 1.94898 offers another layer of resistance that could pose challenges for further upward momentum, and holding as resistance could send EURNZD back to its swing low.
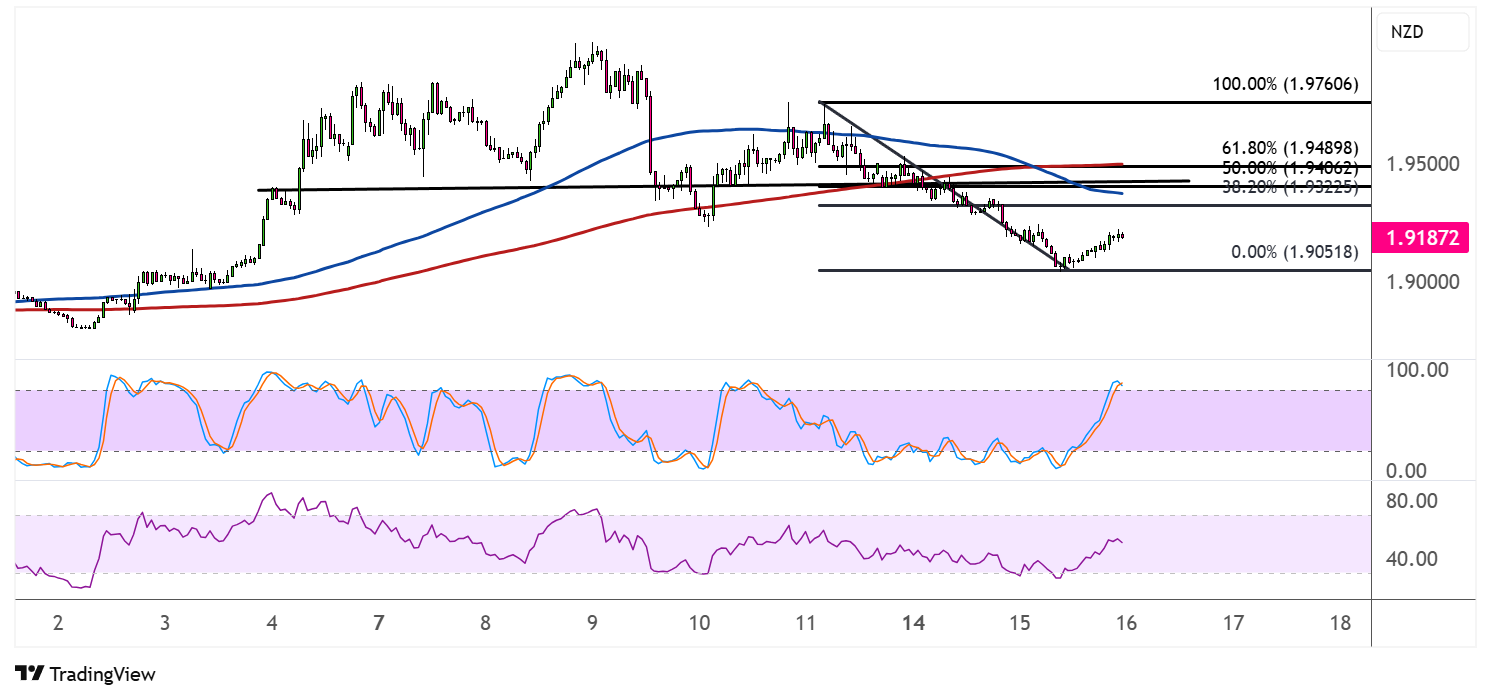
Price is currently trading below both the blue and red moving averages, indicating a bearish bias in the medium term.
However, the recent price action shows the pair attempting to break above these moving averages, which could signal a potential shift in momentum if successful. The crossover of these moving averages formed a bearish signal around March 14th, preceding the sharp decline to swing low.
The stochastic indicator (blue and orange lines in the upper indicator window) has recently moved out of the oversold territory and is now trending upward, suggesting increasing bullish momentum. This coincides with the price bouncing off the 0% Fibonacci level.
The RSI (purple line in the lower indicator window) is also showing signs of recovery from oversold conditions, currently reading around 40-45, and forming higher lows, which aligns with the potential bullish reversal scenario.
Up ahead, the quarterly New Zealand CPI report should serve as a directional catalyst, as stronger inflationary pressures could bring upside for the Kiwi on lower odds of further RBNZ easing.