
NZDCAD is currently consolidating inside a symmetrical triangle pattern on its short-term time frame, with price testing the upper boundary around the 0.8210 handle. This technical formation suggests that a significant breakout could be imminent, with the direction of the break determining the next major move.
The pair is squeezed between converging trend lines that have been containing price action over the past several weeks. A decisive break above the triangle resistance could trigger an uptrend of the same height as the widest part of the formation, potentially propelling NZDCAD toward higher levels.

Conversely, a rejection at current resistance could send the pair back down to test triangle support near 0.8150 or lower.
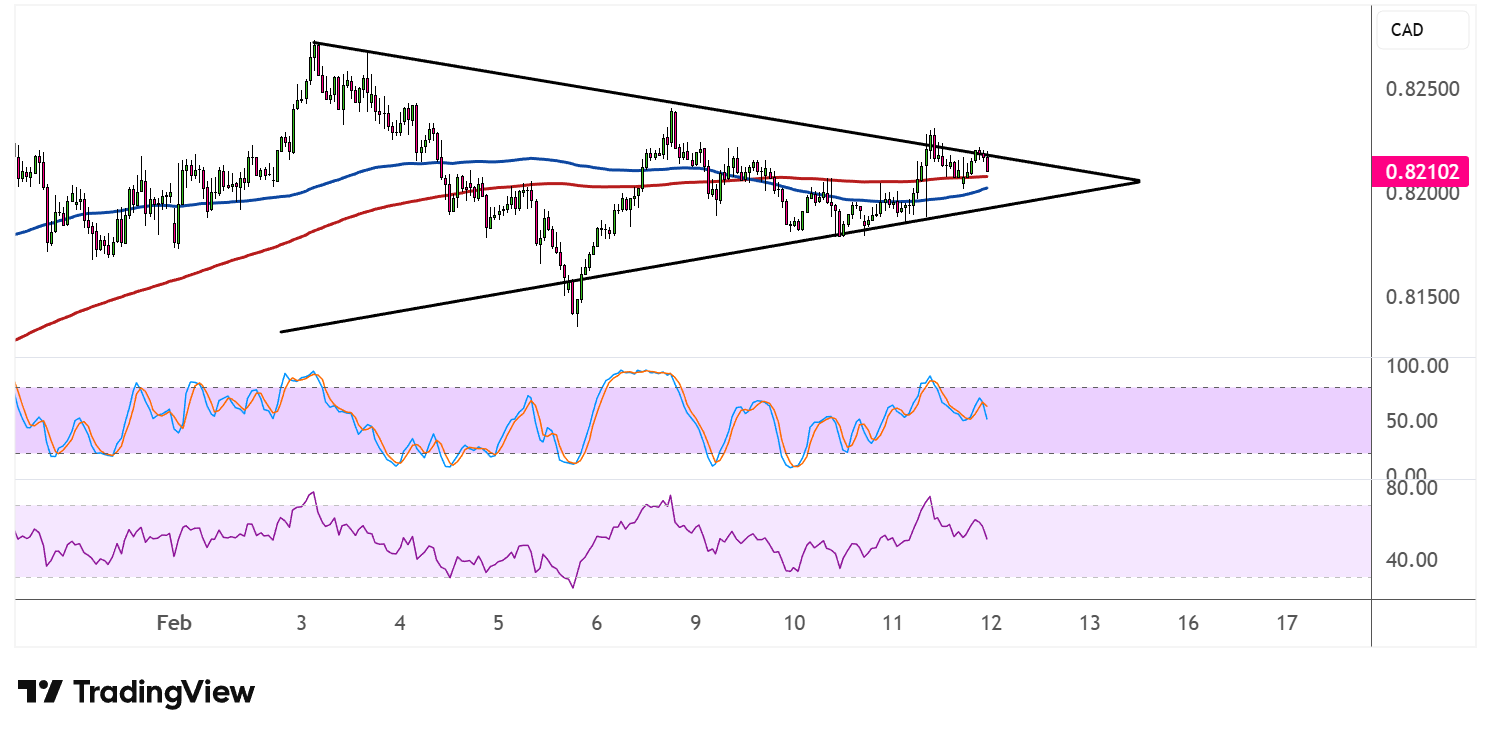
The 100 SMA (blue line) continues to hold above the 200 SMA (red line) to indicate that the path of least resistance remains to the upside or that bulls still have a slight edge. However, the gap between the moving averages has narrowed considerably, suggesting that momentum is waning. Both indicators are positioned within the triangle, providing dynamic support and resistance zones that could influence the breakout direction.
Stochastic is hovering in the middle of its range after oscillating between overbought and oversold territories throughout the triangle formation. The indicator appears to be pointing higher, which could reflect building bullish pressure ahead of a potential upside breakout. However, there’s still room for the oscillator to climb before reaching the overbought zone.
RSI is also positioned in neutral territory and trending sideways, reflecting the ongoing consolidation phase. The momentum indicator has plenty of ground to cover in either direction, suggesting that NZDCAD has sufficient energy stored for a strong breakout move once the triangle resolves.
Traders should watch for a convincing break above 0.8210 with strong momentum to confirm bullish continuation, or a drop below 0.8150 to signal a bearish reversal scenario.