
WTI crude oil has been consolidating inside a symmetrical triangle on the short-term time frame, and price appears to be bouncing off the pattern’s lower boundary after testing support near the $88.83 swing low.
If the bounce gains traction, the commodity could be gearing up for a rally extension toward the Fibonacci extension levels overhead. The Fibonacci tool drawn from the recent swing low to swing high plots the first target at the 38.2% extension level at $100.87, followed by the 50% level at $104.60.

A stronger bullish push could see WTI crude oil stretch toward the 61.8% Fib at $108.32 or even the 76.4% extension at $112.92. The full measured extension sits at $120.36, which could come into play if bulls manage to clear the upper triangle boundary and sustain momentum from there.
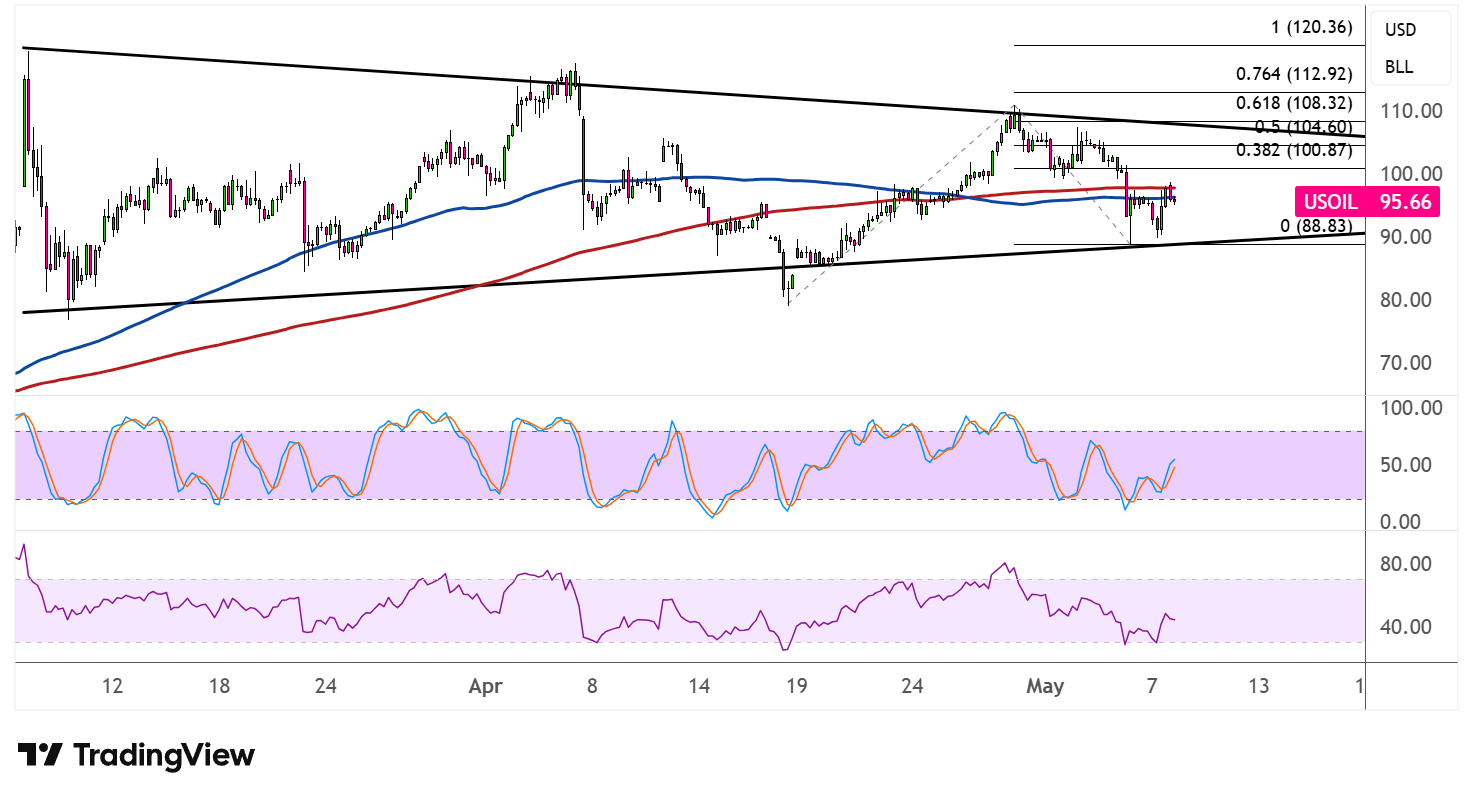
The moving averages are offering a mixed but cautiously bullish read. The 100 SMA recently crossed above the 200 SMA to suggest that the path of least resistance is to the upside, though price has dipped back to test both indicators as dynamic support. Holding above this area would reinforce the bullish bias and keep the triangle bounce scenario intact.
On the oscillators, stochastic is turning higher from the oversold zone, reflecting a pickup in bullish momentum that could fuel the next leg up. The oscillator has plenty of room to climb before reaching overbought territory, which means buyers could maintain control for a while yet.
RSI, however, has been trending lower and still has some ground to cover before reaching the oversold area, suggesting that sellers haven’t fully given up. A sustained turn higher in RSI would add confirmation that the triangle support bounce is gaining real traction.
Traders will be watching crude inventory data and geopolitical developments closely, as these could tip the balance between a sustained breakout and a deeper pullback toward the triangle floor.