
WTI crude oil is approaching a critical inflection point, as price inches closer to the resistance of a symmetrical triangle pattern that has been developing since early March.
The formation’s converging trendlines are squeezing price action tighter, with the upper boundary now sitting near the $100.00–$101.00 area and the lower boundary providing a rising floor closer to $90.00.

A breakout above the triangle resistance could trigger a measured move rally equal to the height of the formation, potentially propelling crude oil toward the $110.00 swing high area.
However, the resistance near current levels could also act as a roadblock, sending price back toward the triangle support and the mid-$90s before another attempt higher.
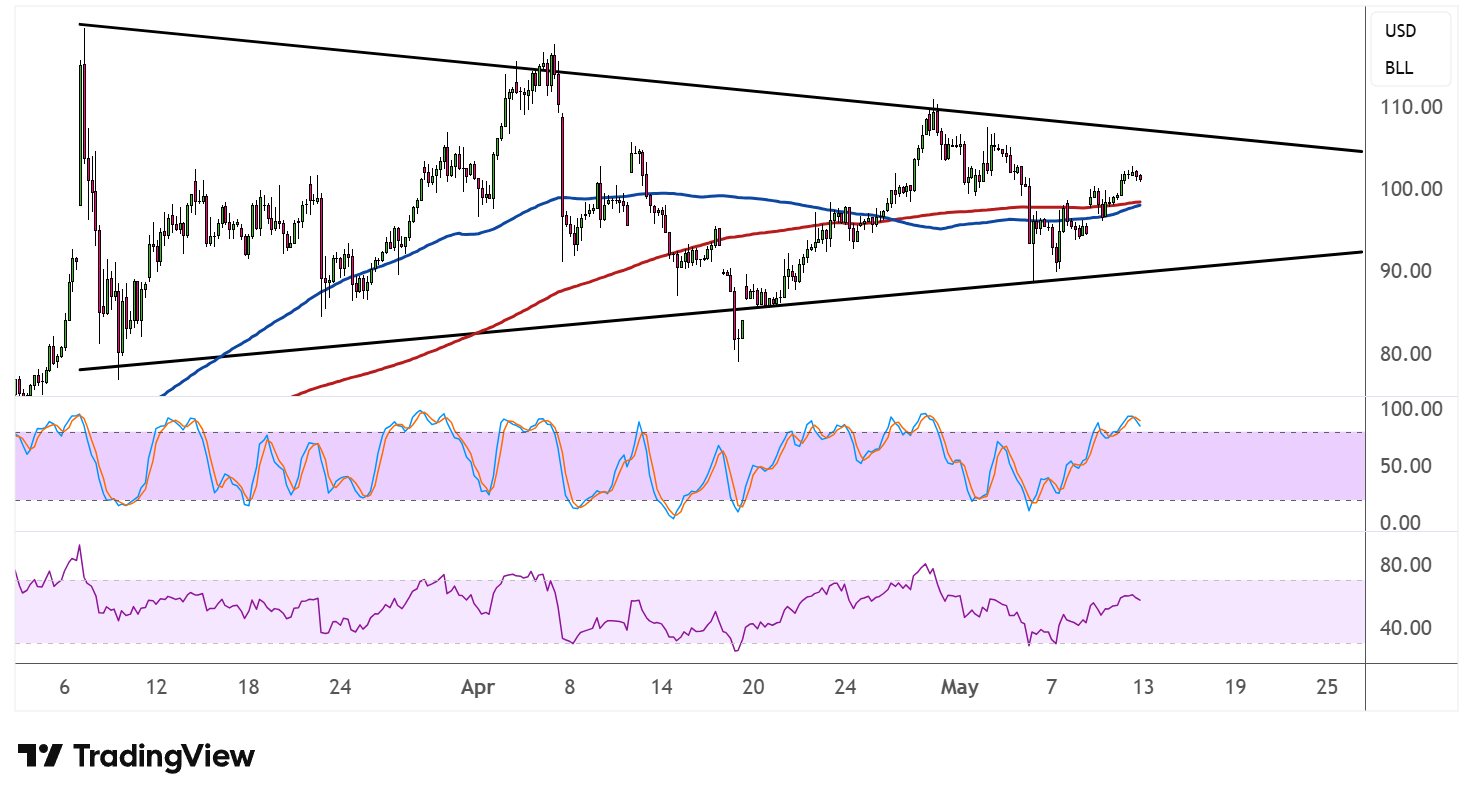
The 100 SMA and 200 SMA are converging near the $100.00 handle, with price hovering just above both indicators. This confluence of dynamic resistance and triangle resistance makes the current zone particularly significant, as a clean break and close above could see the moving averages flip to dynamic support on any subsequent dips.
Stochastic is on the rise and fast approaching the overbought region, reflecting building bullish momentum but also hinting that buyers could be running low on fuel. If the oscillator turns lower from overbought territory, a pullback toward the triangle support or the moving averages would be on the cards.
RSI is also climbing toward its upper boundary but hasn’t quite reached the overbought zone yet, leaving some room for additional upside follow-through before sellers regain the upper hand.
A decisive bullish candle closing above the triangle resistance could open the door to a sustained rally, while a rejection at current levels could bring the $90.00–$92.00 support range back into focus.
WTI crude oil could take cues from geopolitical developments, with the latest breakdown in peace proposal discussions and Trump saying the ceasefire is on “life support” elevating risks once again.