
WTI crude oil has been navigating a prolonged downtrend, with a descending trend line connecting the series of lower highs from the late April peak near $107 per barrel all the way down to current levels around $93.60.
Price is now testing this trend line resistance once again, but the more intriguing development is that the commodity appears to be carving out a series of higher lows since the late May swing low near $87, hinting that bearish momentum may be losing steam.

A highlighted area of interest around the $94–$96 zone marks a key confluence region where the descending trend line converges with both moving averages. A sustained break above this area could confirm a trend reversal and open the door for a more significant recovery move to the upside.
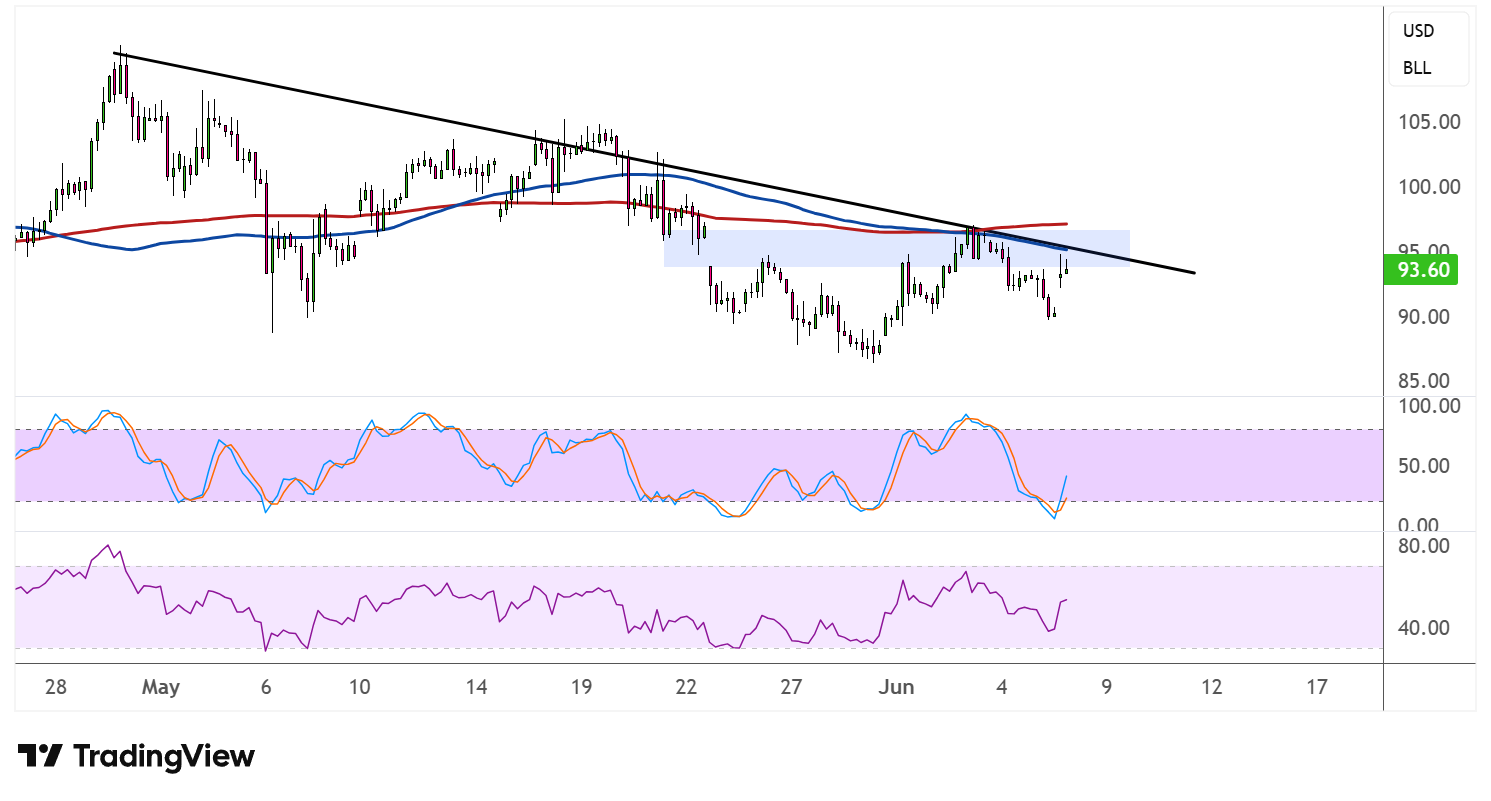
The 100 SMA (blue) has crossed below the 200 SMA (red) and both indicators are sloping downward, confirming that the path of least resistance remains to the downside for now. Price is currently trading beneath both moving averages, which could continue to act as dynamic resistance on any attempted rallies.
However, stochastic recently dipped into the oversold region before turning sharply higher, suggesting that sellers are running out of momentum and that buyers are beginning to step in. The oscillator’s strong upturn from oversold territory is an encouraging sign for bulls eyeing the trend line break.
RSI, meanwhile, has been recovering from its own lows and is climbing toward the midpoint, reflecting a gradual shift in momentum. If RSI can clear above the 50 level while price pushes through the descending trend line, it could validate a broader bullish reversal, potentially targeting the $100 level and beyond.
Geopolitical tensions continue to keep crude oil supported, as US-Iran talks have yet to bear fruit and the closure of the Strait of Hormuz is keeping global supply constrained.