
EURAUD is testing the descending trend line resistance of a descending triangle pattern that has been forming since early July, with the pair pulling back slightly after tagging the upper boundary near 1.6378.
The descending trend line has been capping rallies for weeks now, while a solid horizontal floor around the 1.6300 major psychological mark has held on multiple test attempts, creating the classic triangle setup.

Price recently spiked up to challenge the descending trend line but has since faded a bit, leaving the outcome of this test still very much in question.
If EURAUD fails to clear the descending trend line, a slump back to the 1.6300 support could be in the cards, and a break below that floor could spell a larger drop equal to the height of the triangle formation.
On the other hand, a decisive close above the trend line resistance could open the door for a measured move rally, projecting gains roughly equal to the widest part of the triangle, potentially setting sights on the 1.6500 region or higher.
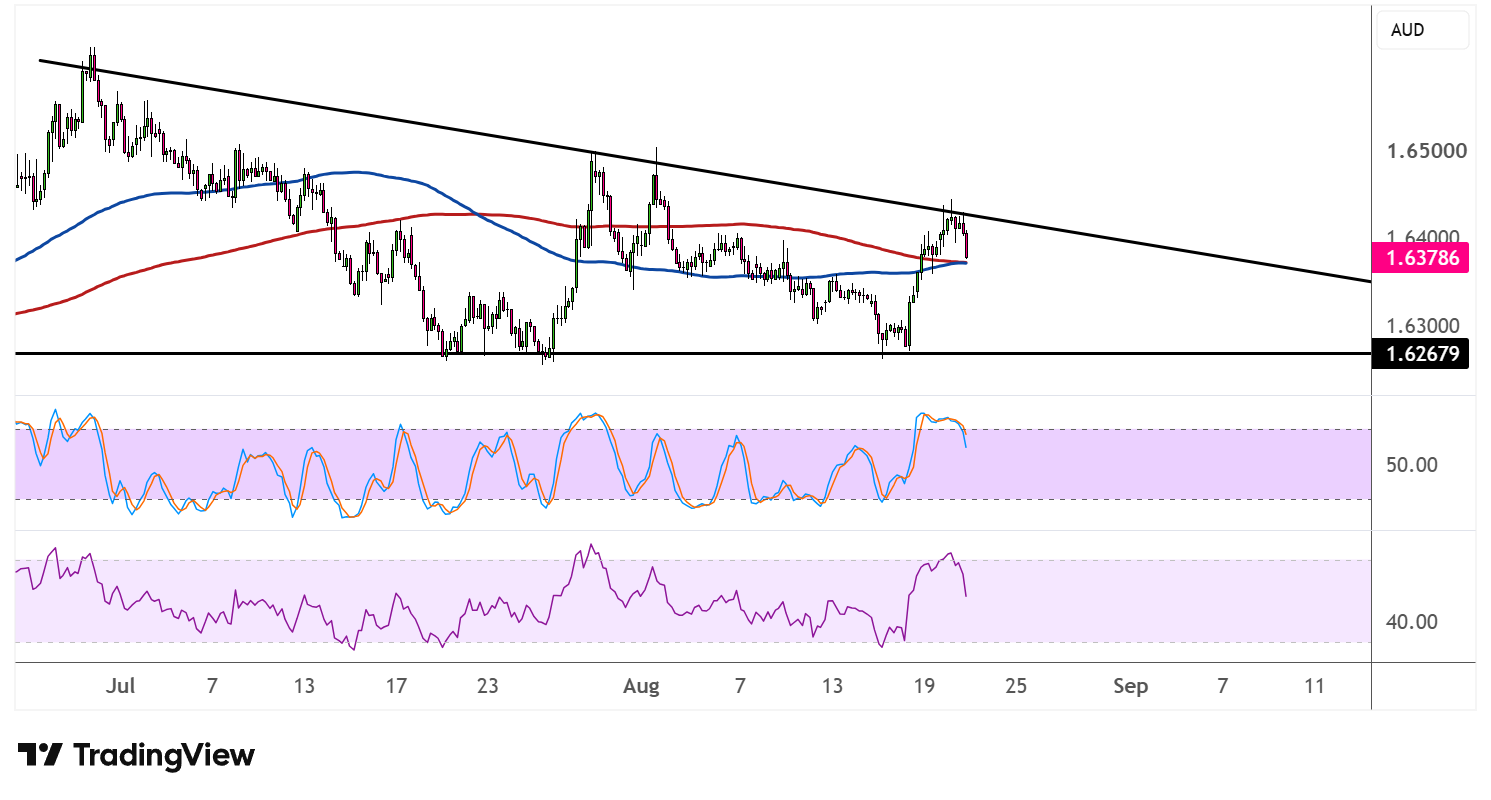
The 100 SMA has moved above the 200 SMA to suggest that the path of least resistance could be shifting to the upside, with the gap between the indicators widening as bullish pressure builds. Price is also holding above both moving averages for now, which could act as dynamic support on pullbacks.
Stochastic reached the overbought region and is now curling lower, hinting that buyers may be running out of steam near this resistance test. RSI, on the other hand, has room to climb before hitting overbought territory, so a bit more upside could still be in play if buyers manage to shrug off the recent pullback.
EURAUD may also take cues from upcoming central bank commentary from the RBA and ECB, as diverging policy expectations between the two could dictate whether the pair breaks higher or reverts back to the range lows.