
Natural gas has been climbing inside an ascending channel since mid-August, with price recently spiking to a fresh high near $2.873 before losing steam.
The rally appears to be running out of momentum, and a pullback is now underway as price retreats from the channel’s upper boundary back toward the middle of the range.

The break above the shorter-term rising trend line that connected the swing lows suggests buyers may be taking some profit after the sharp advance off the $2.650 area. Even so, the broader ascending channel remains intact, keeping the bigger uptrend bias alive as long as price holds above the channel bottom near $2.700.
The Fibonacci retracement tool highlights where dip-buyers could step back in. The 38.2% level lines up at $2.783, while the 50% retracement sits at $2.755, close to current price around $2.765.
A deeper correction could test the 61.8% Fib at $2.727, which lines up closely with the 100 SMA and 200 SMA, an area that could serve as a stronger support confluence if the pullback extends.
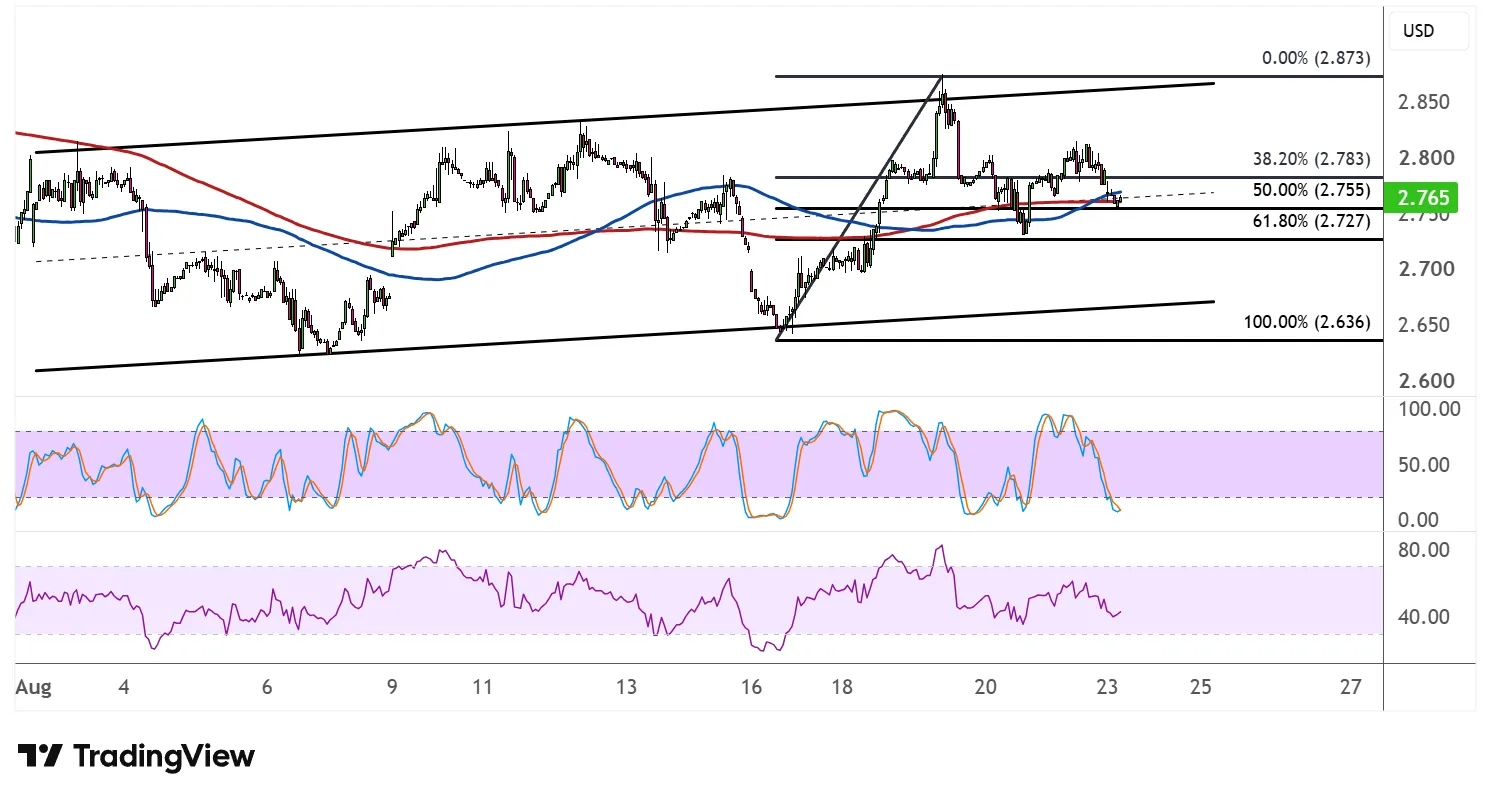
On the moving average front, the 100 SMA and 200 SMA are converging just below spot price, hinting that the short-term and longer-term trends are aligning. A dynamic support zone could form here if the correction reaches this cluster, potentially reinforcing the case for a bounce back toward the channel top.
Stochastic is curling down from the overbought region, reflecting fading bullish momentum and possible near-term weakness. With plenty of room left before reaching oversold territory, the pullback could still have further to run before buyers regain full control.
RSI has also eased off its highs and is drifting lower, mirroring the stochastic signal. As long as RSI stays out of oversold conditions, the broader uptrend structure could remain valid, with a potential resumption of gains back toward the $2.850–$2.873 resistance zone if the Fib levels hold as support.