
WTI crude oil has been in a steady uptrend since mid-August, with price climbing off the lows near $80.00 to test the $87.65 area before pulling back.
The recent pullback has price testing the rising trend line that connects the higher lows since the rally began, a level that could determine whether the climb has more room to run.

Price also broke above a shorter-term ascending trend line earlier in the move, confirming bullish momentum, but the latest retreat has price slipping back below that line, hinting that buyers may need to regroup before resuming the ascent.
The Fibonacci retracement tool shows where dip-buyers could return to the fray. The 38.2% level is at $86.01, while the 50% retracement sits at $85.50, close to the current price near $85.69.
A deeper pullback could reach the 61.8% Fib at $85.00, which lines up with the longer-term rising trend line, a confluence that could serve as the line in the sand for the uptrend.
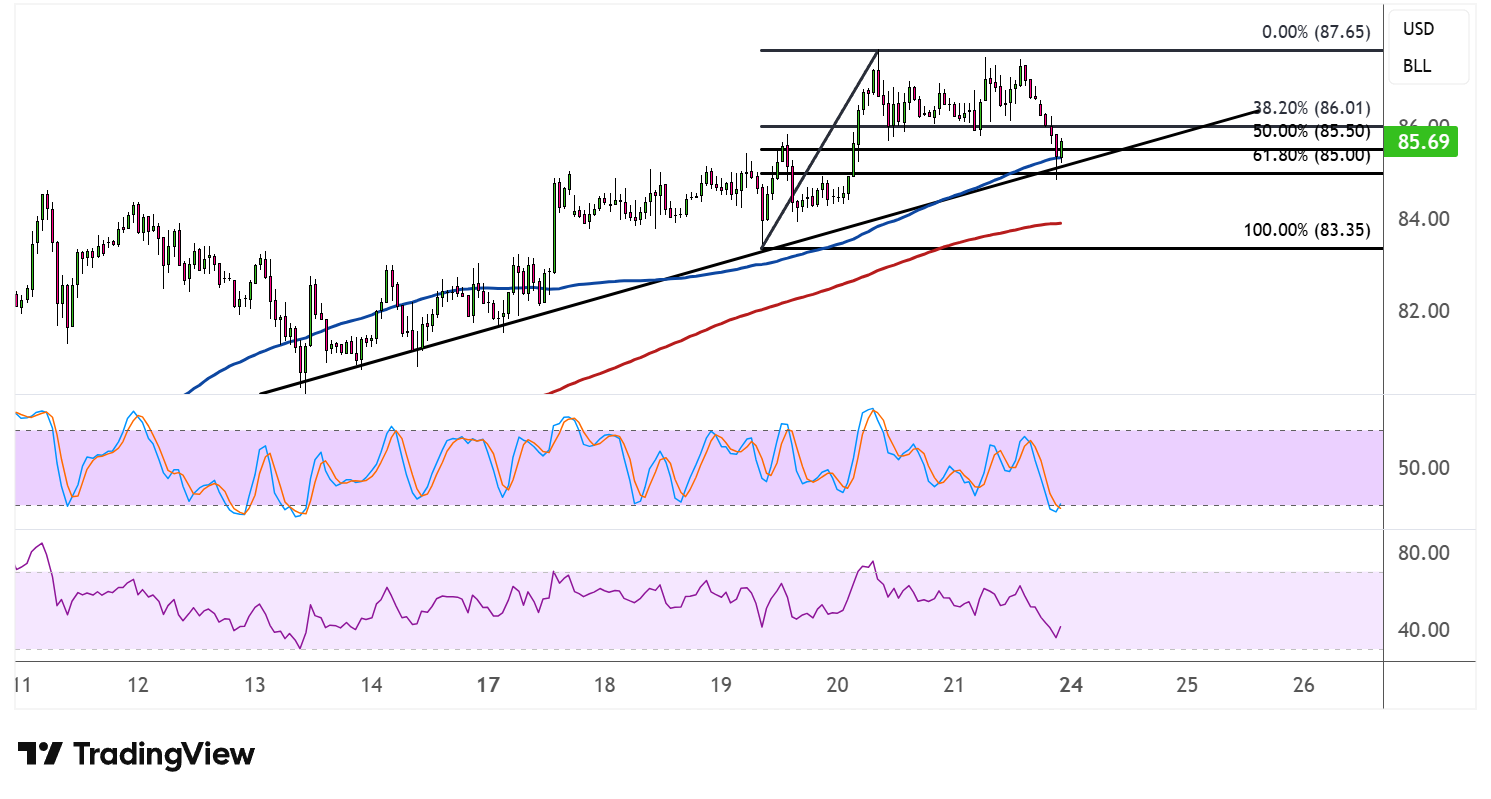
The 100 SMA remains above the 200 SMA, confirming that the path of least resistance is still to the upside, and price is holding above both moving averages, which could act as dynamic support if the correction extends further.
Stochastic has already dropped into the lower half of its range, reflecting the recent loss of momentum, but with the oscillator not yet in oversold territory, there could still be some downside left before buyers regain full control.
RSI is also easing off its highs and drifting toward the midline, mirroring the pullback in price. As long as RSI holds above the oversold threshold, the broader uptrend structure could remain intact.
If the trend line and Fib confluence near $85.00 hold as support, WTI could resume its climb toward the $87.65 swing high or higher. A break below this zone, however, could open the door to a deeper correction toward the $83.35 area.