
Natural gas has been climbing steadily inside an ascending channel since mid-August, with higher lows finding support along the channel bottom.
Price recently pulled back from a rising wedge formed near the $2.940 to $2.970 region, dipping to test the channel floor and the confluence of the 100 SMA around $2.822.

If the channel bottom holds as a floor, natural gas could resume its climb and revisit the broken wedge resistance before pushing toward higher Fibonacci extension levels.
The Fibonacci tool drawn from the recent swing shows the 38.2% level at $2.914, followed by the 50% level at $2.942 and the 61.8% level at $2.970, which lines up closely with the wedge resistance and could be a tough nut to crack on the first attempt.
A stronger rally that clears these hurdles could open the door to the 76.4% level at $3.005, with the swing high extension at $3.062 as the next ceiling to watch. On the other hand, a break below the channel support could spell a deeper pullback, possibly dragging price back toward the $2.800 handle or lower.
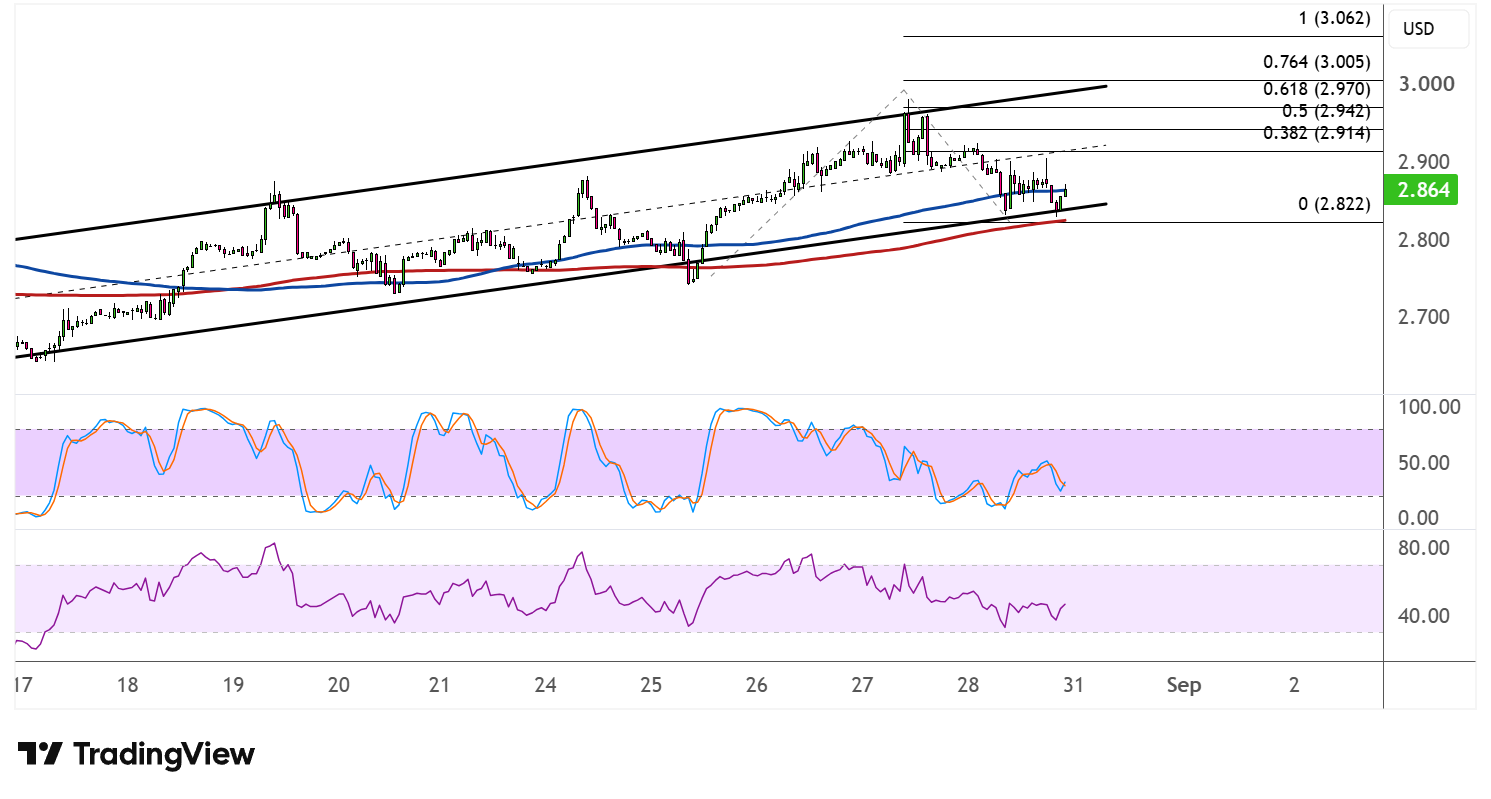
Looking at the moving averages, the 100 SMA remains above the 200 SMA, keeping the path of least resistance tilted to the upside for now, even though the gap between the two has been narrowing as the pullback unfolded. Price is also hovering just above both indicators, hinting that these could act as dynamic support if buyers step back in.
Stochastic has been sliding from the overbought zone and is now approaching the midpoint, suggesting that bearish pressure could persist a bit longer before buyers regain control. RSI is also on a downtick, currently hovering in the 40s with room to fall before reaching oversold territory, so price could keep drifting lower in the near term.
Still, as long as the ascending channel support holds, natural gas bulls may have the opportunity to regroup and aim for a fresh test of the upper Fibonacci extension levels.