
WTI crude oil has been consolidating inside a symmetrical triangle since late July, with sellers capping the upside near the descending trend line while buyers have been stepping in at progressively higher lows along the rising trend line.
Price is now pushing up to retest the triangle’s upper boundary near $85.00, putting the pattern at a critical juncture.

A rejection at this resistance could send WTI back down toward the triangle’s rising support line, which currently sits in the $82.00 to $83.00 area and roughly aligns with the 100 SMA and 200 SMA, both of which have converged in that zone.
A bounce off this support would keep the consolidation intact and could set up another run at resistance down the line.
On the other hand, a decisive breakout above the upper trend line could validate the symmetrical triangle and open the door to a measured move rally. Given the height of the pattern near its widest point around late July, a successful breakout could eventually project gains toward the high-$90s to $100 region, assuming the standard measured-move calculation for this chart pattern.
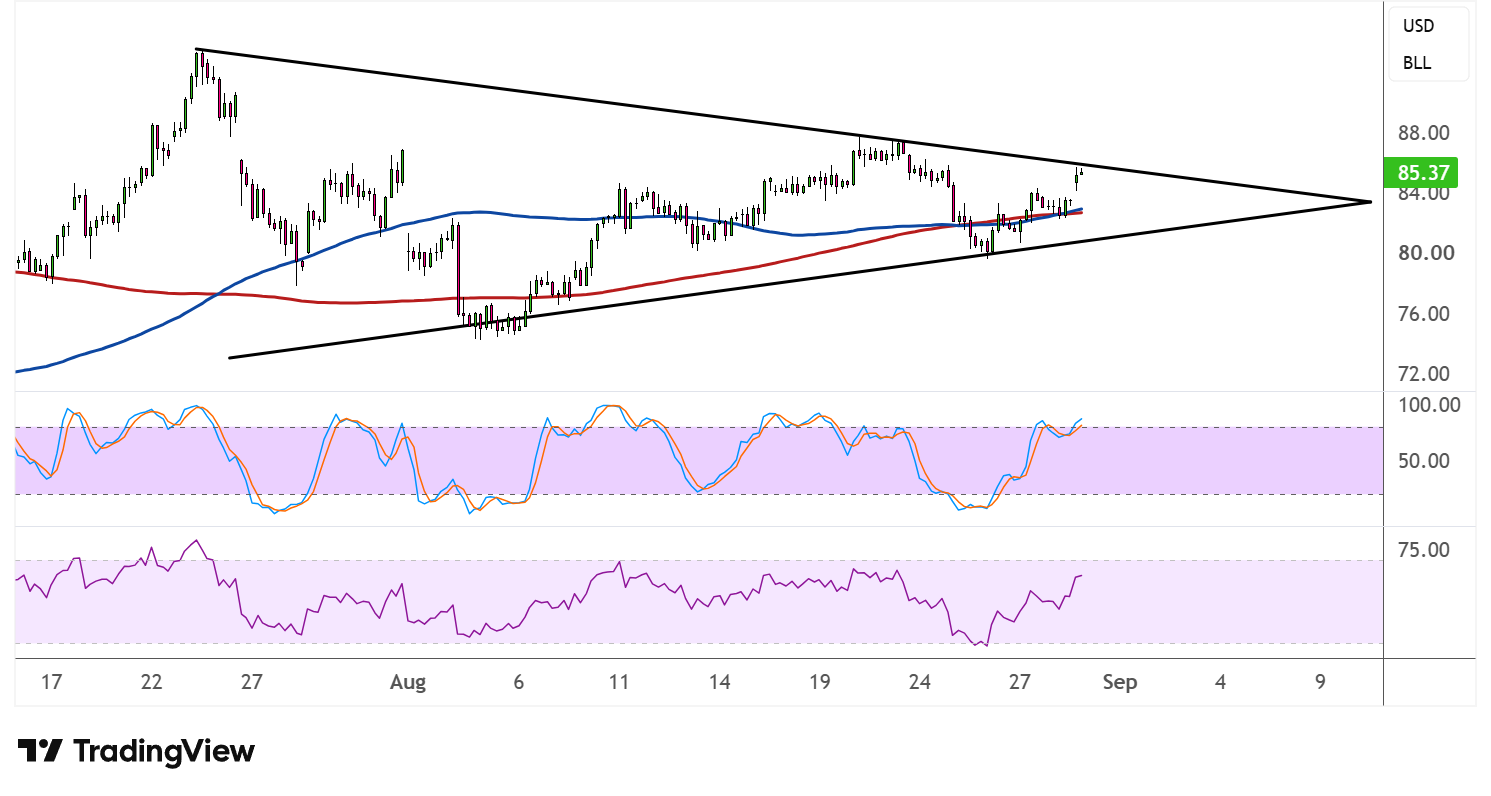
The moving averages reflect the underlying tug-of-war, as the 50 SMA has recently crossed above the 100 SMA, hinting that momentum may be turning bullish and that these lines could function as dynamic support on any dips.
Stochastic has climbed sharply out of the oversold zone and is now approaching overbought territory, reflecting the recent burst of buying pressure. If the oscillator turns lower from here, it could mean sellers are stepping back in near resistance, while a push through the ceiling could confirm a breakout attempt.
RSI has also been trending higher and is nearing the overbought threshold, suggesting buyers currently have the upper hand, though the oscillator has limited room left before signaling exhaustion, which could result in a pause or pullback before any sustained breakout takes hold.