
Natural gas has been climbing steadily inside a well-defined ascending channel since late August, with rising lows and rising highs keeping the broader uptrend intact.
After topping out near the $3.061 mark, price pulled back sharply but appears to be finding its footing right around the channel’s lower boundary near $2.882, currently hovering around $2.914.

If this trend line support continues to hold, natural gas could resume its climb toward the swing high and beyond. The Fibonacci retracement tool, drawn from the channel bottom at $2.882 to the recent peak at $3.061, highlights the levels bulls need to reclaim to confirm that the correction is over.
The 38.2% Fib sits at $2.950, while the 50% level is at $2.971. A more convincing recovery would need to clear the 61.8% Fib at $2.992 and the 76.4% level at $3.019, which could open the door for a retest of the $3.061 swing high or an extension beyond it if channel support keeps proving reliable.
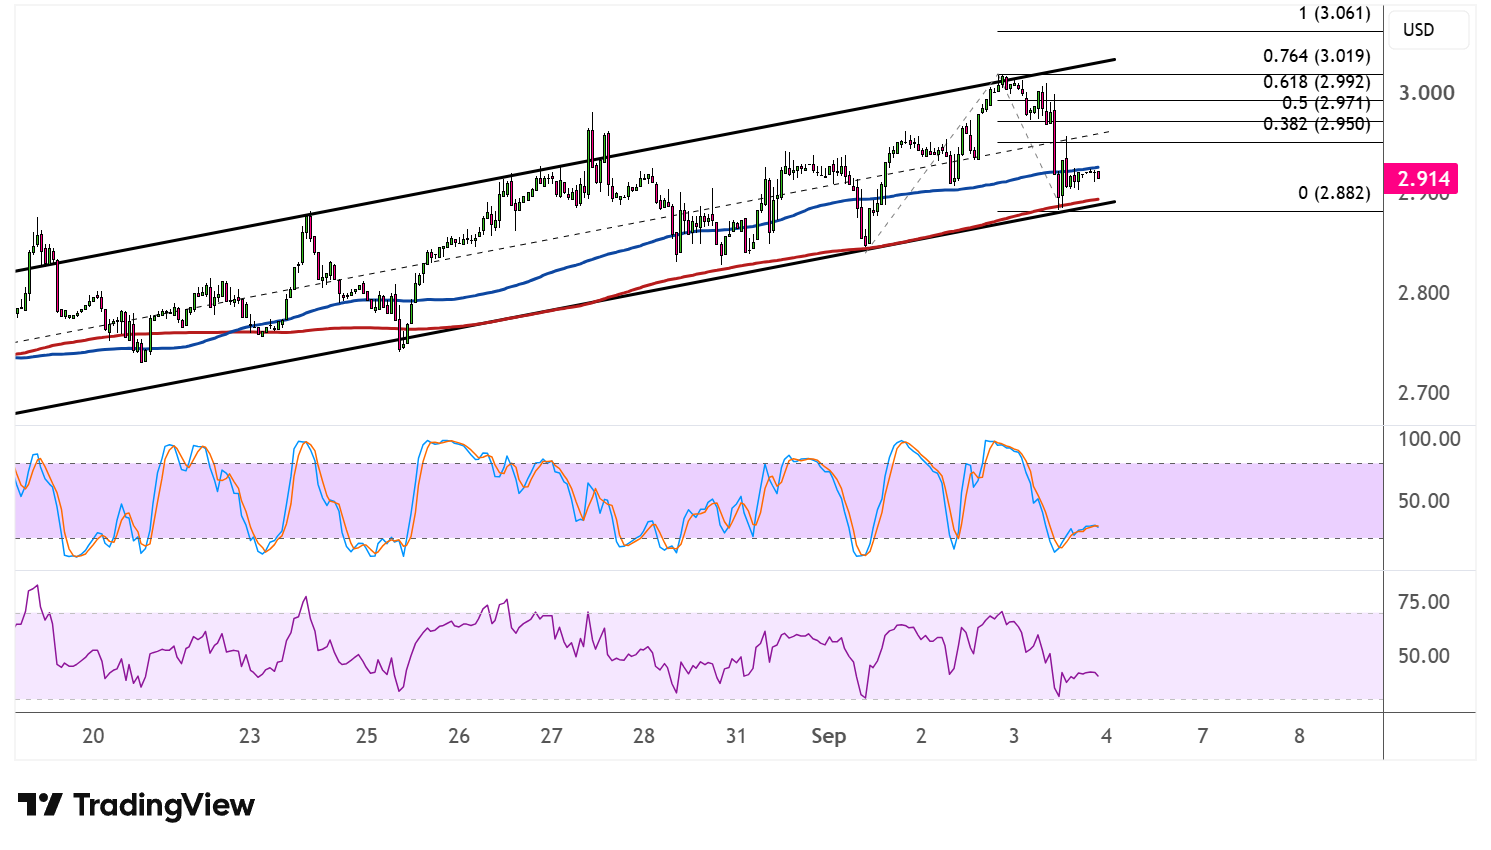
On the moving average front, the 100 SMA remains above the 200 SMA, keeping the path of least resistance tilted to the upside. Price is trading close to both averages, so a bounce off this dynamic support zone would align with the broader bullish structure still in play.
Stochastic recently dipped toward the lower end of its range but is already curling higher, suggesting selling momentum is fading and buyers may be stepping back in. RSI, meanwhile, is easing back toward the midline but still has plenty of room to climb before reaching overbought territory, meaning there’s scope for price to extend gains if buying pressure returns.
As always, natural gas remains sensitive to weather forecasts and weekly inventory data, both of which could sway near-term direction. A larger-than-expected build in stockpiles could weigh on price, while a bigger draw could reinforce the bullish case for a move back toward the channel top.