
Gold: Testing 50% Fib Support and Trendline
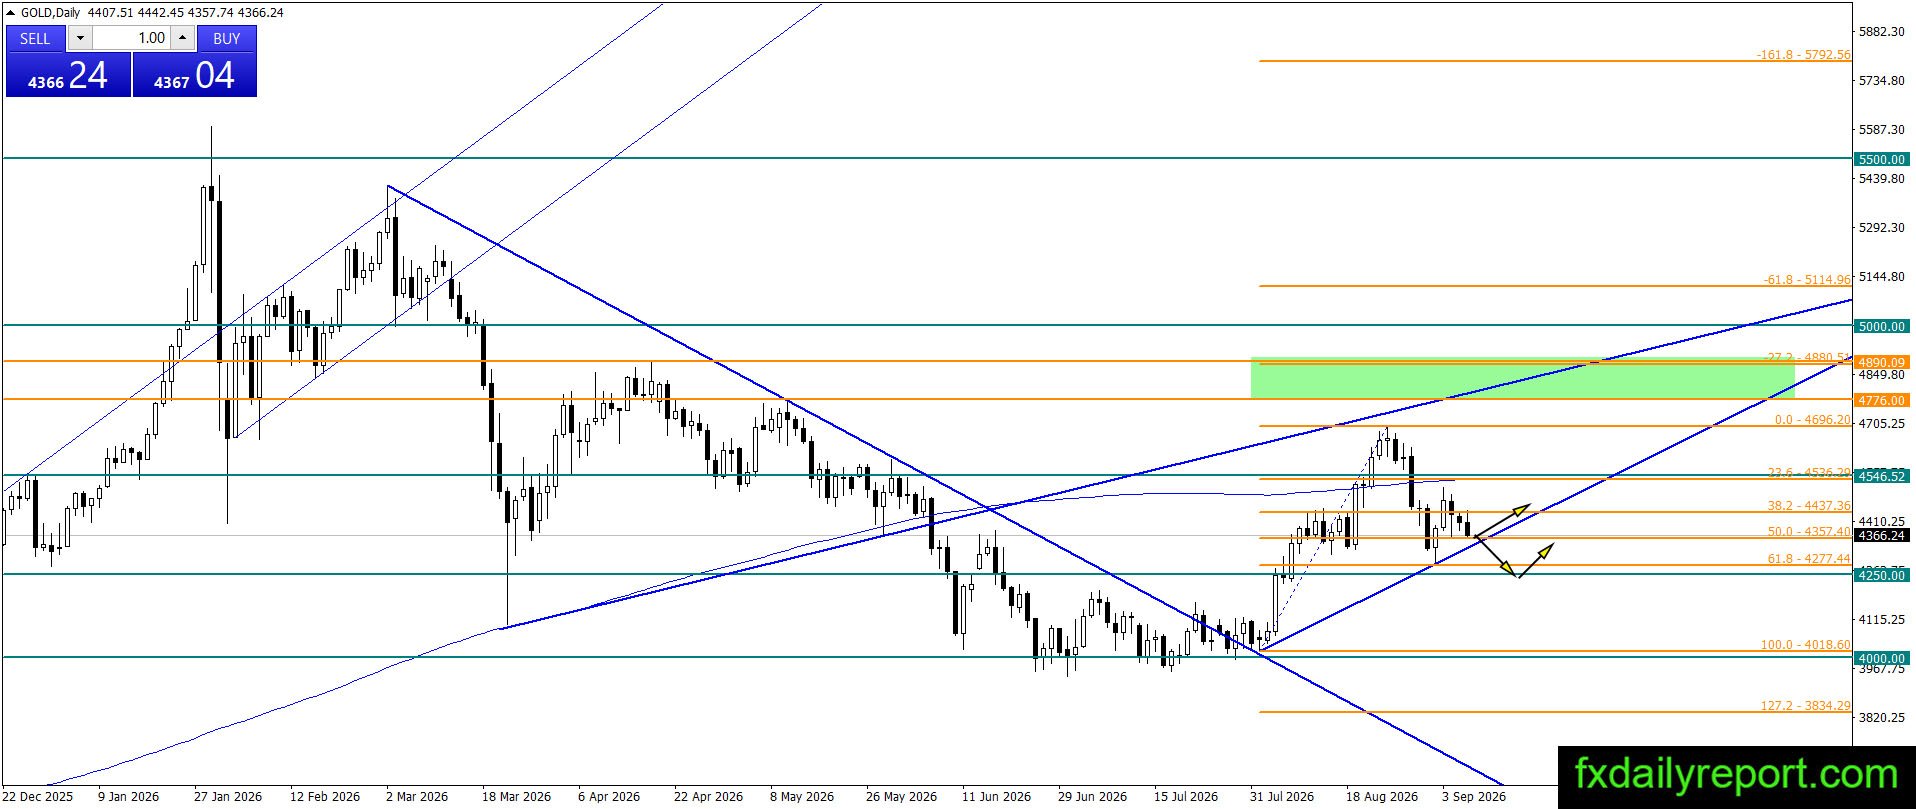
Gold came under renewed bearish pressure during Tuesday’s session, sliding down to test the 50% Fibonacci retracement level ($4,357.40). Technical charts show a redrawn ascending trendline just below current price action, which could serve as a dynamic pivot zone for a potential bullish bounce. However, if sellers break below this trendline without a bounce, the major horizontal support level at $4,250 will be the critical floor to watch to preserve the broader upward structure.
Today’s critical levels to watch:

Support: $4,380, $4,250, $4,000
Resistance: $4,500, $4,546, $4,700
Silver: Under Pressure but Holding Within $64.00 – $70.00 Range
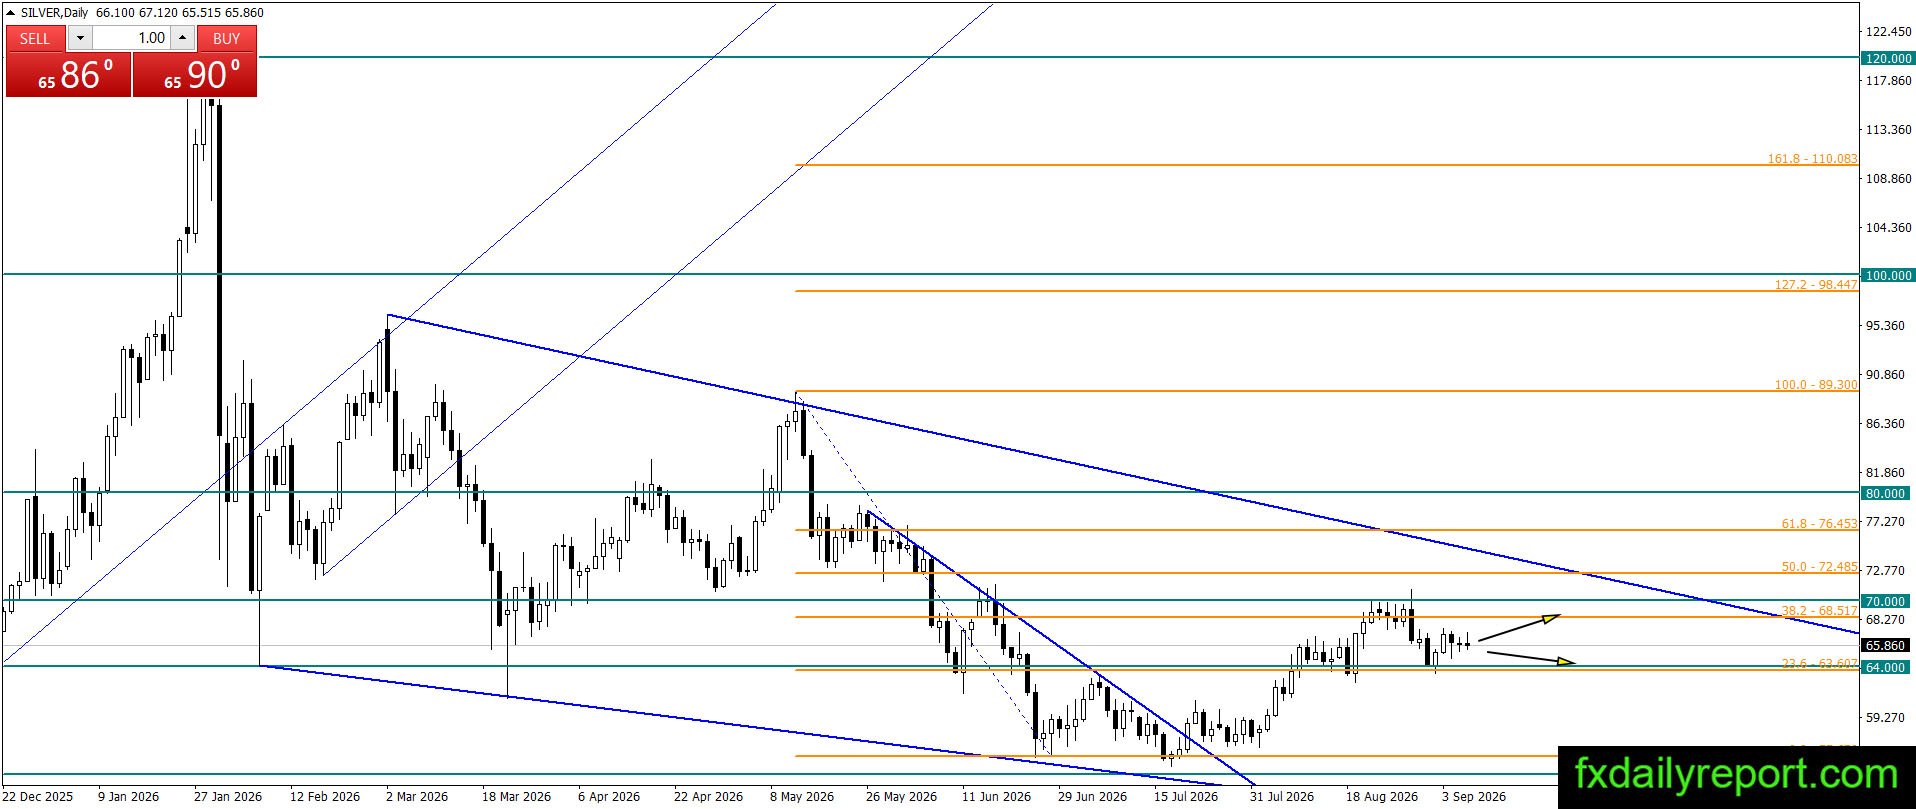
Silver is similarly experiencing bearish pressure alongside gold, though price action remains mostly stable inside its established range. For now, the overall consolidation band between $64.00 and $70.00 continues to hold intact. Should prices turn lower in the upcoming sessions, the $64.00 level stands as the primary line of support that buyers must defend to keep the broader structure grounded.
Today’s critical level to watch:
Support: $64.00, $54.00, $50.00
Resistance: $70.00, $80.00, $83.91, $85.00, $100.00, $120.00
Crude Oil: Reaches $95.00 Mark and Prints Higher High
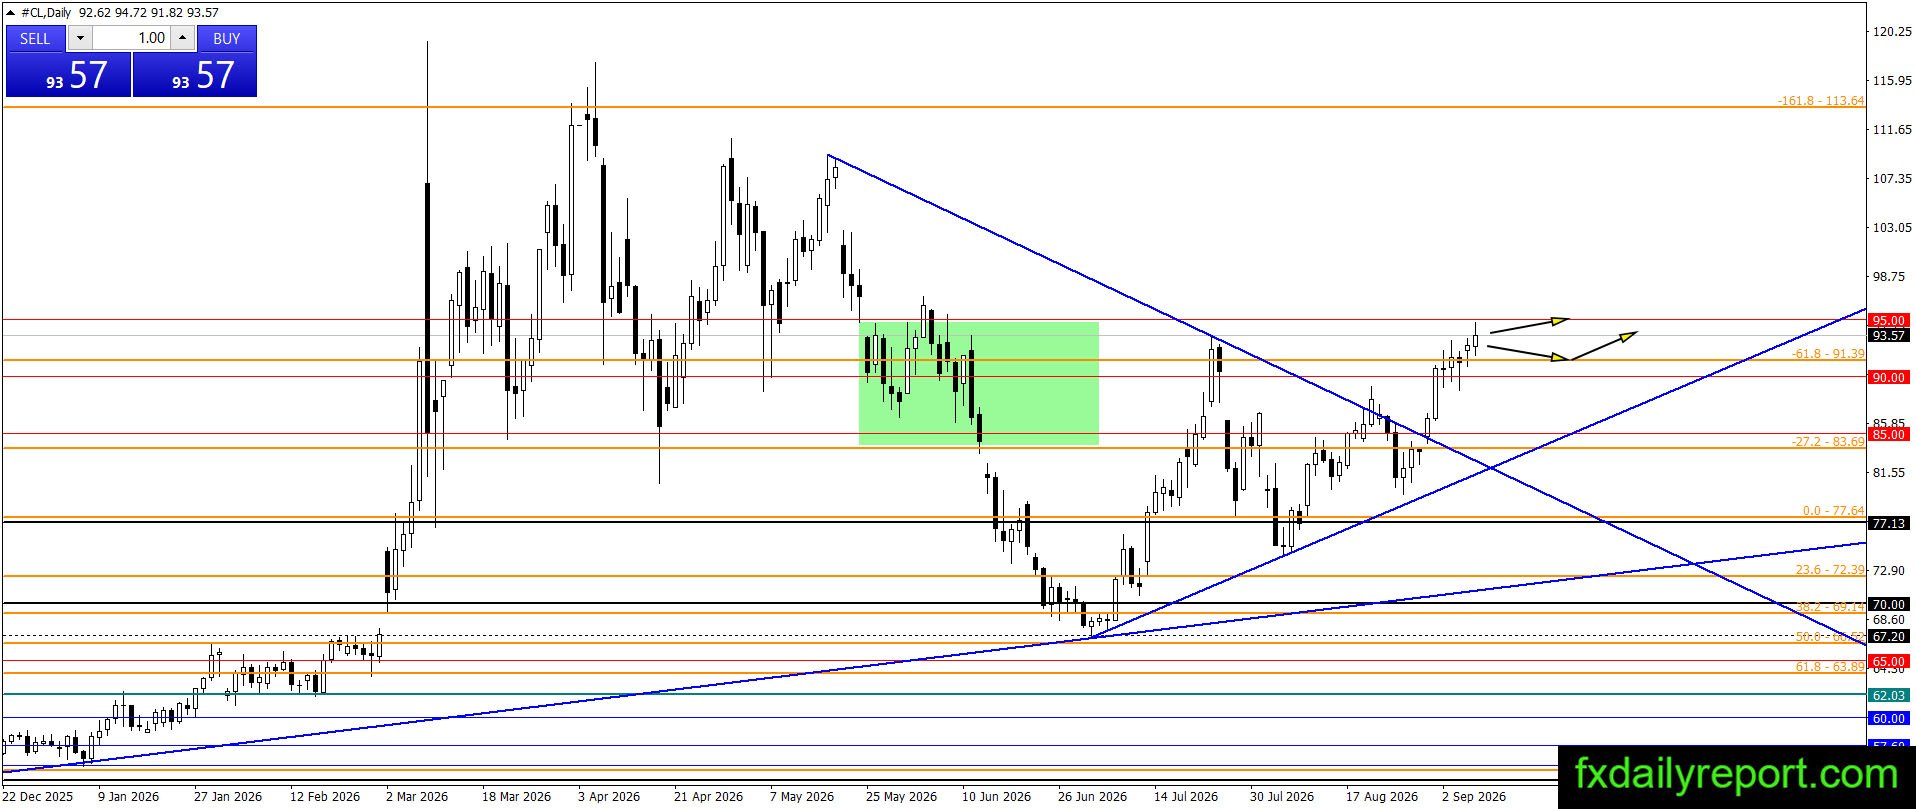
Crude oil pushed higher once again, tapping the $95.00 level and printing a fresh higher high. While buyers continue to maintain immediate control of the market momentum, the situation remains 50:50 until a decisive breakout above $95.00 is established. Traders will be watching closely to see if bulls can sustain a daily close above this major resistance zone or if a consolidation phase emerges.
Today’s critical level to watch:
Support: $90.00, $85.00, $80.00, $77.13, $70.00, $67.20
Resistance: $95.00