
GBPCHF has been carving out a symmetrical triangle pattern since mid-August, with lower highs and higher lows converging toward a tighter and tighter consolidation range.
Price is now testing the upper trend line resistance near 1.0975, and the narrowing price action suggests that a decisive breakout could be just around the corner.

A break above the upper trend line could pave the way for a bullish continuation, potentially matching the height of the triangle at its widest point for a measured move higher. Given how wide the pattern was near the start of the formation, this could translate to a sizable rally if confirmed.
Conversely, a break below the rising trend line support near 1.0940 could trigger a drop of similar magnitude, so traders may want to wait for a clear break and hold before committing to a direction.
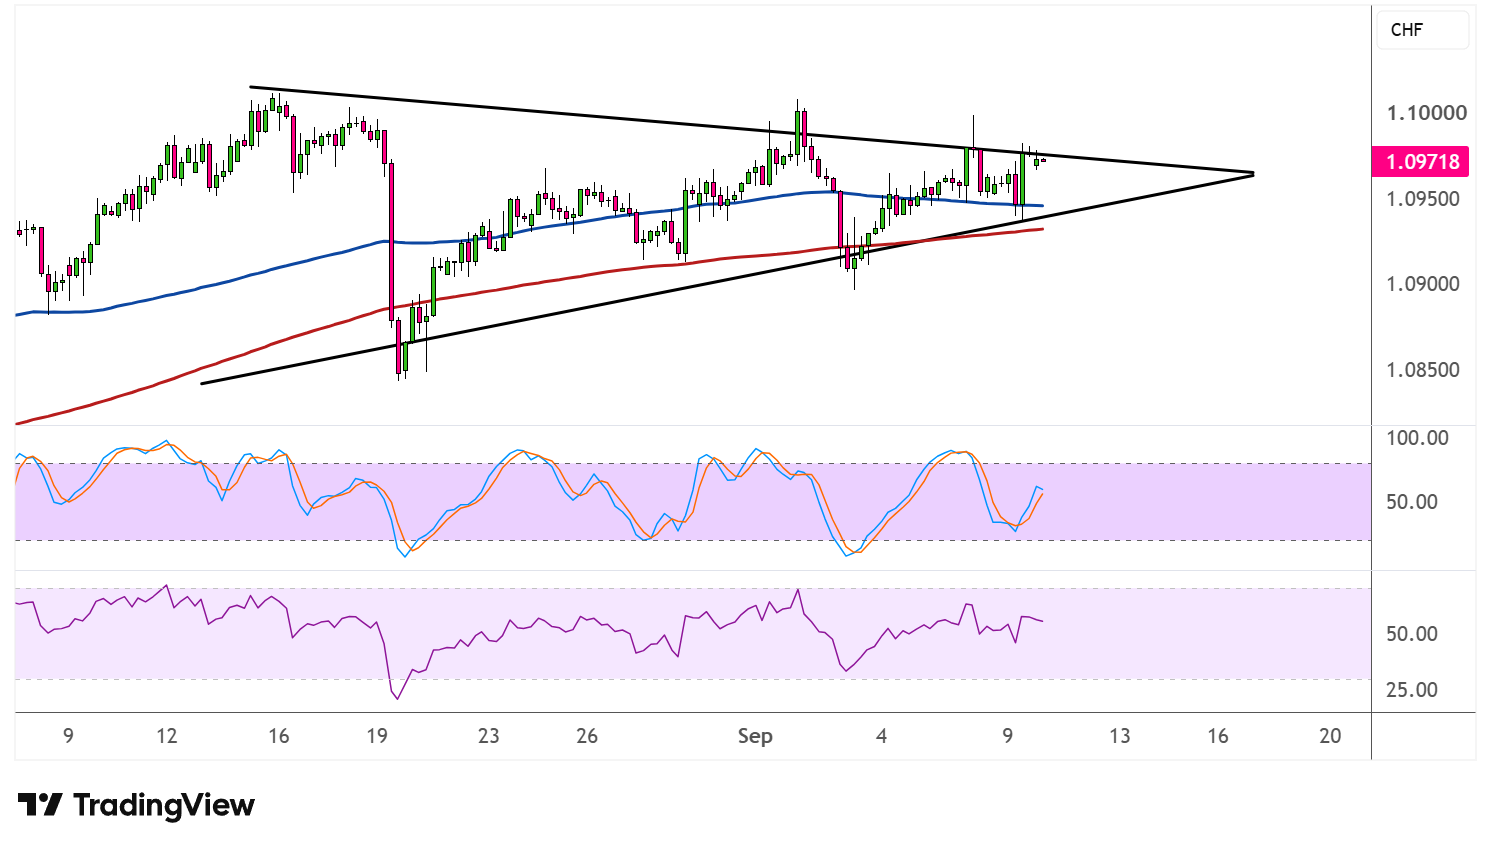
The 100 SMA is above the 200 SMA, indicating that the path of least resistance remains tilted to the upside for now, or that the pair is more likely to resolve higher than lower once the triangle resolves. Price is also hovering close to both moving averages, which could serve as dynamic support on any dips back into the pattern.
Stochastic recently bounced off the oversold region and is now turning higher, reflecting a return in bullish momentum that lines up with the recent push toward triangle resistance. The oscillator has room to climb before reaching overbought, so the upside push could still have legs.
RSI is also recovering from oversold territory and is now trending upward, mirroring the improvement seen on the stochastic. If both oscillators continue climbing in tandem with price, this could favor an upside resolution to the triangle.
Still, given the tightening range, GBPCHF traders should watch for a strong close beyond either trend line to confirm the next directional move.