
On Friday, the WTI crude oil price pulled back from the session highs of about $98.49 to trade at about $95.89. The oil price trades within a descending channel formation on the 60-minute chart.
The light crude oil price has now plummeted to trade a few levels below the 100-hour moving average line. However, it recently bounced back to recover from the oversold levels of the 14-hour RSI.
WTI Crude Oil Fundamentals Overview

From a fundamental perspective, the light crude oil price trades during a relatively busy period in the US market. On Friday, the US industrial production for August missed the expected (MoM) change of 0.3%, with a change of 0%. On Thursday, the US initial jobless claims for last week came in lower than expected, at 196k versus a forecast of 208k, down from the previous update of 206k.
The September Philadelphia Fed Manufacturing Survey outperformed the forecast reading of 30.5, with a reading of 37.8, down from the previous month’s equivalent of 47.4. On the other hand, pending home sales for August fell short of the forecast (MoM) change of 2%, with a change of 0.3%. Earlier in the week, the Federal Reserve raised the base interest rate by 25 basis points to 4%, up from 3.75% as expected.
In the latest US crude inventories, the API weekly crude oil stock for last week increased to 7.14 million, up from the previous week’s equivalent of -0.3 million, missing the forecast of -1.8 million. On the other hand, the EIA crude oil stocks change for last week fell to -0.64 million, down from the preceding week’s -0.391 million, missing the forecast of -1.6 million.
WTI Crude Oil Technical Analysis (the 60-min Chart)
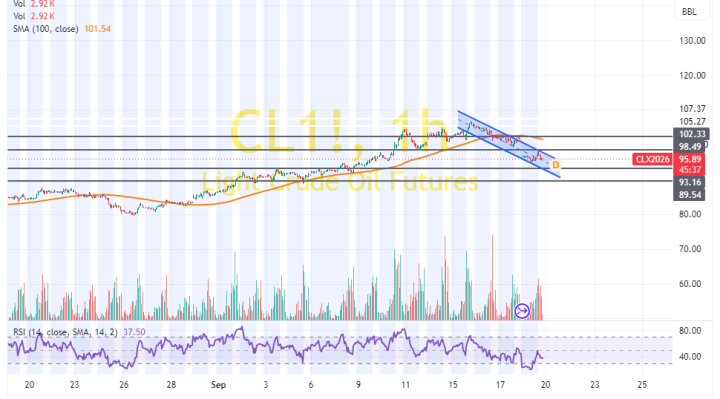
Technically, the WTI crude oil price trades within a descending channel formation on the 60-minute chart. However, the 14-hour RSI has recently bounced back to recover from oversold conditions.
Therefore, the bulls will look to stretch the latest rebound towards $98.49 or higher, up to $102.33. On the other hand, the bears will look to pounce on profits at about $93.16 or lower, down to $89.54.
WTI Crude Oil Technical Analysis (the Daily Chart)
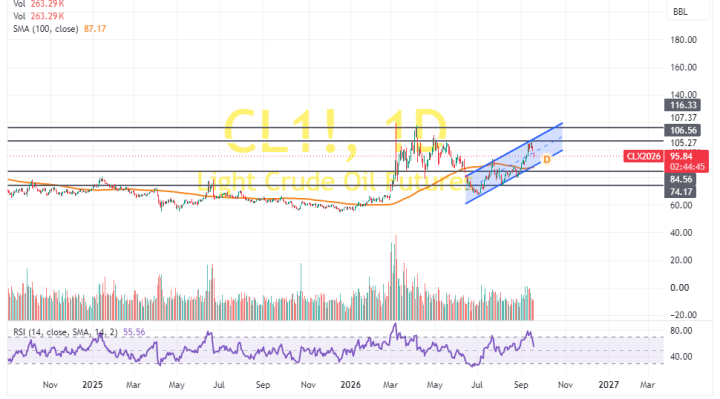
In the daily chart, the light crude oil price trades within an ascending channel formation. However, the 14-day RSI has recently pulled back to recover from overbought conditions.
Therefore, the bears will look to extend the current pullback towards $84.56 or lower, down to $74.17. On the other hand, the bulls will look to pounce on rebounds at about $106.56 or higher, up to $116.33.